. 2016 May;135(5):541-553.
doi: 10.1007/s00439-016-1651-0. Epub 2016 Apr 4.

Refining the Y chromosome phylogeny with southern African sequences

Affiliations

Refining the Y chromosome phylogeny with southern African sequences

Chiara Barbieri et al. Hum Genet. 2016 May.

Abstract

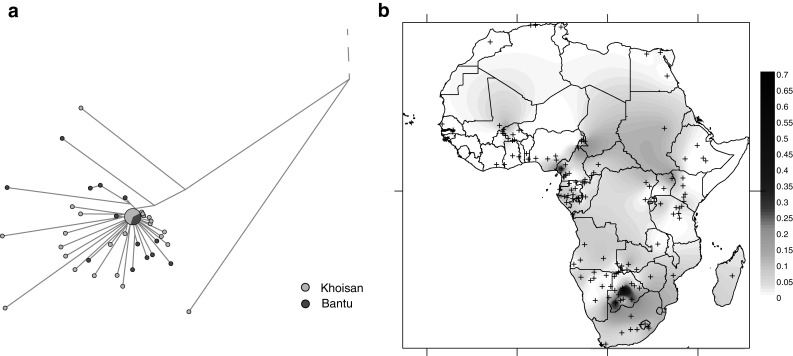
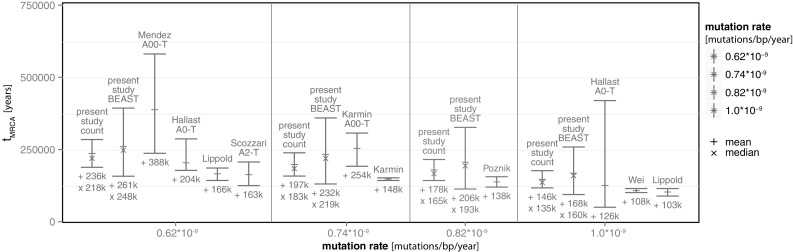
The recent availability of large-scale sequence data for the human Y chromosome has revolutionized analyses of and insights gained from this non-recombining, paternally inherited chromosome. However, the studies to date focus on Eurasian variation, and hence the diversity of early-diverging branches found in Africa has not been adequately documented. Here, we analyze over 900 kb of Y chromosome sequence obtained from 547 individuals from southern African Khoisan- and Bantu-speaking populations, identifying 232 new sequences from basal haplogroups A and B. We identify new clades in the phylogeny, an older age for the root, and substantially older ages for some individual haplogroups. Furthermore, while haplogroup B2a is traditionally associated with the spread of Bantu speakers, we find that it probably also existed in Khoisan groups before the arrival of Bantu speakers. Finally, there is pronounced variation in branch length between major haplogroups; in particular, haplogroups associated with Bantu speakers have significantly longer branches. Technical artifacts cannot explain this branch length variation, which instead likely reflects aspects of the demographic history of Bantu speakers, such as recent population expansion and an older average paternal age. The influence of demographic factors on branch length variation has broader implications both for the human Y phylogeny and for similar analyses of other species.


Conflict of interest statement

The authors declare that they have no conflict of interest.

Figures

Fig. 1
Fig. 1
Maximum parsimony (MP) tree for the southern African dataset, rooted with A00. The width of the triangles is proportional to the number of individuals included. Previously unreported lineages are highlighted. Branches are numbered to identify them in Table S1 (Online Resource 2), where information on the defining mutations and comparison with other nomenclature systems are reported. Branch number 1 indicates the branch shared by A2 and A3b1, which is not visible as a separate branch in the MP reconstruction
Fig. 2
Fig. 2
Diversity and distribution of haplogroup B2a. a Network of B2a sequences color coded by linguistic affiliation (Khoisan vs. Bantu speaking individuals). The dashed line indicates the position of branch 21 from Fig. 1, which leads to the root of B2a. b Schematic distribution of haplogroup B2a in Africa: the more intense the color, the higher the frequency in the population. Small crosses mark the locations of the 146 African populations included in the analysis (see Supplemental Table S3)
Fig. 3
Fig. 3
Values of TMRCA for the A2-T node from the present study. The dates are obtained by direct count and by BEAST analysis, for four different mutation rates (indicated with different colors); both median and mean estimates are indicated. The dates are compared with estimates from other studies (indicated by the name of the first author), which variously dated the same A2-T node (not explicitly labeled in the figure) or the A00-T or A0-T nodes (identified above the bars) (color figure online)
Fig. 4
Fig. 4
Distances to the A2-T node in number of mutations. a Distribution of distances from each tip to the A2-T node. b Density distribution of distances to the A2-T node for each major haplogroup. Haplogroups are color-coded as in Fig. 1 (color figure online)

References

    1. Baele G, Lemey P, Bedford T, et al. Improving the accuracy of demographic and molecular clock model comparison while accommodating phylogenetic uncertainty. Mol Biol Evol. 2012;29:2157–2167. doi: 10.1093/molbev/mss084. - DOI - PMC - PubMed
    1. Baele G, Li WLS, Drummond AJ, et al. Accurate model selection of relaxed molecular clocks in bayesian phylogenetics. Mol Biol Evol. 2013;30:239–243. doi: 10.1093/molbev/mss243. - DOI - PMC - PubMed
    1. Barbieri C, Vicente M, Rocha J, et al. Ancient substructure in early mtDNA lineages of southern Africa. Am J Hum Genet. 2013;92:285–292. doi: 10.1016/j.ajhg.2012.12.010. - DOI - PMC - PubMed
    1. Barbieri C, Güldemann T, Naumann C, et al. Unraveling the complex maternal history of Southern African Khoisan populations. Am J Phys Anthropol. 2014;153:435–448. doi: 10.1002/ajpa.22441. - DOI - PubMed
    1. Barbieri C, Vicente M, Oliveira S, et al. Migration and interaction in a contact zone: mtDNA variation among Bantu-speakers in southern Africa. PLoS One. 2014;9:e99117. doi: 10.1371/journal.pone.0099117. - DOI - PMC - PubMed

Publication types

LinkOut - more resources