. 2016 Jun;17(6):721-727.
doi: 10.1038/ni.3424. Epub 2016 Apr 4.

TCR signal strength controls thymic differentiation of discrete proinflammatory γδ T cell subsets

Affiliations

TCR signal strength controls thymic differentiation of discrete proinflammatory γδ T cell subsets

Miguel Muñoz-Ruiz et al. Nat Immunol. 2016 Jun.

Abstract

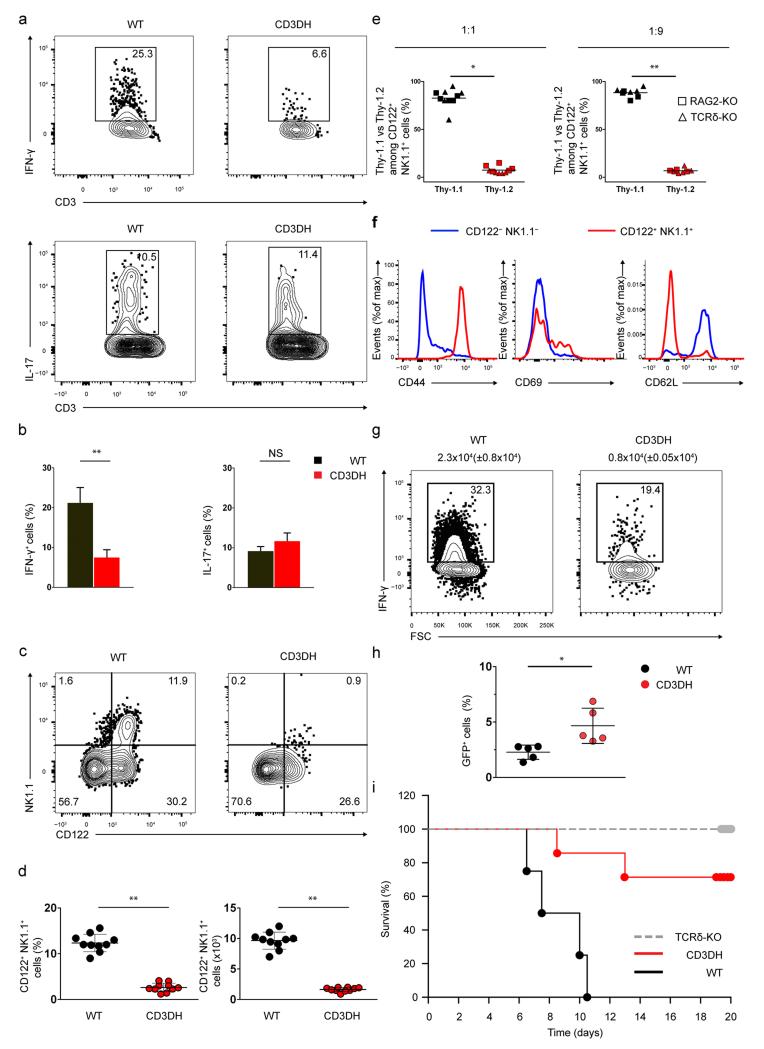
The mouse thymus produces discrete γδ T cell subsets that make either interferon-γ (IFN-γ) or interleukin 17 (IL-17), but the role of the T cell antigen receptor (TCR) in this developmental process remains controversial. Here we show that Cd3g(+/-) Cd3d(+/-) (CD3 double-haploinsufficient (CD3DH)) mice have reduced TCR expression and signaling strength on γδ T cells. CD3DH mice had normal numbers and phenotypes of αβ thymocyte subsets, but impaired differentiation of fetal Vγ6(+) (but not Vγ4(+)) IL-17-producing γδ T cells and a marked depletion of IFN-γ-producing CD122(+) NK1.1(+) γδ T cells throughout ontogeny. Adult CD3DH mice showed reduced peripheral IFN-γ(+) γδ T cells and were resistant to experimental cerebral malaria. Thus, TCR signal strength within specific thymic developmental windows is a major determinant of the generation of proinflammatory γδ T cell subsets and their impact on pathophysiology.


Figures

Figure 1
Figure 1. γδ T cells from CD3DH mice show reduced TCRγδ expression and signaling
(a) Flow cytometry showing the CD3ε vs TCRδ phenotype of thymocytes from one-week old wildt-ype (WT) or Cd3g+/− Cd3d+/− (CD3DH) mice (n = 10 per group). Numbers within outlined areas or quadrants indicate % cells in each throughout. (b-f) TCRγδ MFI (b) and γδ thymocyte numbers (c) gated as in (a), CD8 vs CD4 phenotype of thymocytes (n = 3 per group of adult mice) (d), TCRαβ MFI (e) and absolute numbers of TCRβ+CD3+ thymocytes (f). (g-i) Flow cytometry showing expression of the indicated agonist selection and maturation markers in gated TCRδ+CD3+CD27+ thymocytes (g), of CD69 and CD25 in sorted TCRδ+CD3+CD27+ spleen cells stimulated with plate-coated α-CD3ε mAb for 24h (h), of phosphorylated Erk1/Erk2 (empty histograms) vs isotype-matched background staining (filled histograms) in sorted TCRδ+CD3+CD27+ lymph node cells stimulated for 5 min with soluble α-CD3ε mAb (i). Data are representative of 3 independent experiments. (j, k) Flow cytometry showing comparative TCRγδ MFI (j) and Thy-1.1( WT-derived) vs Thy-1.2 (CD3DH-derived) fractions among gated TCRδ+CD3+ and CD4+CD3+ thymocytes (k) from 1:1 mixed WT:CD3DH bone marrow chimeras. Each symbol indicates one host, either RAG2−/− (squares) or TCRδ−/− (triangles). In (b,c) and (e,f), dots represent individuals and horizontal lines mean ± s.d. NS, not significant; *P < 0.01 (Student’s t-test).
Figure 2
Figure 2. CD3DH mice show impaired differentiation of IL-17+ and IFN-γ+ γδ T cells within selective windows of TCR Vγ usage
(a-c) Flow cytometry at various developmental stages showing representative surface CD27 expression in gated CD3+TCRδ+ thymocytes (n = 10 per mice group) (a), intracellular IL-17 in CD3+TCRδ+CD27 thymocytes ( b ) and IFN-γ expression in CD3+TCRδ+ CD27+ thymocytes (c) from WT or CD3DH mice following stimulation with PMA and ionomycin. Data are representative of two to four experiments per developmental stage. Numbers indicate the % cells in the marked region. (d) Percent CD27IL-17+ (top) and CD27+IFN-γ+ (bottom) γδ T cells in WT and CD3DH mice (n = 5 per group) as determined in (b) and (c), respectively. Data shown are the mean +/− s.d. *P < 0.05; **P < 0.01 (Student’s t-test). (e) Vγ usage by CD27IL-17+ or CD27+IFN-γ+ γδ T cells at various developmental stages (n = 7 per group), as determined by flow cytometry. (f) Flow cytometry showing intracellular IL-17 expression in CD3+TCRδ+CD27 thymocytes from E18 WT or CD3DH mice following stimulation with PMA and ionomycin. Numbers indicate % cells in the marked region.
Figure 3
Figure 3. Transcriptional signatures of TCR signal strength in γδ thymocytes
(a) Microarray heatmap of differentially expressed genes during ontogeny in sorted CD3+TCRδ+ γδ thymocytes of WT or CD3DH mice (>2-fold adult/fetal between week 5-7 and E18). (b) Fold expression by real-time RT-PCR (in arbitrary units normalized to the housekeeping gene Hprt) of Egr2, Egr3, Nt5e (encoding CD73), Sox4, Il23r and Ilr1 genes by sorted CD3+TCRδ+γδ thymocytes from WT or CD3DH mice before and after 16h stimulation with α-CD3ε mAb (10 μg/ml). Data shown are the mean +/− s.d. *P < 0.05; **P < 0.01 (Student’s t-test).
Figure 4
Figure 4. CD3DH mice lack IFN-γ hi CD122+ NK1.1+ thymocytes that are rescued by CD3 crosslinking in vivo
(a) Flow cytometry showing representative NK1.1 vs CD122 expression in TCRδ+CD3+CD27+ thymocytes isolated from adult WT or CD3DH mice (n = 10 per group). Numbers indicate % cells in each quadrant. (b) Frequencies (left) and total numbers (right) of TCRδ+CD3+CD27+CD122+NK1.1+ thymocytes. Each dot represents an individual mouse; bars indicate the mean +/− s.d. *P < 0.01 (Student’s t-test) throughout. (c, d) Flow cytometry showing representative Vγ1 vs Vγ4 chain usage (c) and surface CD44, CD73, CD45RB or intracellular IFN-γ production (d) by the indicated gated TCRδ+CD3+CD27+ thymocyte subsets from adult WT mice (n = 5 per group). Data are representative of at least three independent experiments. (e) Flow cytometry showing representative NK1.1 vs CD122 expression (top) within Thy-1.1+ ( WT-derived) or Thy-1.2+ (CD3DH-derived) fractions (bottom) of TCRδ+CD3+CD27+CD122+NK1.1+ thymocytes from 1:1 or 1:9 mixed bone marrow chimeras. Each symbol indicates one host, either RAG2−/− (squares) or TCRδ−/− (triangles). (f, g) Flow cytometry showing representative NK1.1 vs CD122 expression (f) and % (left) and numbers (right) of TCRγδ+CD3+CD27+ CD122+NK1.1+ thymocytes (g) in WT or CD3DH mice, 5 days after i.p. injection of α-CD3 mAb 17A2 ( n = 3 per group). Each dot represents an individual mouse; bars indicate the mean +/− s.d.
Figure 5
Figure 5. CD3DH mice show reduced peripheral IFN-γ+ γδ T cells and are resistant to cerebral malaria
(a,b) Intracellular IFN-γ (top) or IL-17 (bottom) expression in CD27+ or CD27 TCRδ+CD3+ adult mice splenocytes, respectively, stimulated with PMA and ionomycin (a). Numbers indicate % of cells in the marked region, which are shown for n = 5 per group in (b). (c, d) NK1.1 vs CD122 expression in TCRδ+CD3+CD27+ adult mice splenocytes (c). Numbers indicate % of cells in each quadrant, which are shown in (d) for n = 20 per group as % (left) or total numbers (right). (e) Thy-1.1 (WT-derived) vs Thy-1.2 ( CD3DH-derived) fractions among TCRδ+CD3+CD27+CD122+NK1.1+ splenocytes from 1:1 or 1:9 mixed WT:CD3DH BM chimeras. Each symbol indicates one host, either RAG2−/− (squares) or TCRδ−/− (triangles). (f) Comparative surface expression of the indicated markers in CD122NK1.1 vs CD122+NK1.1+ cells gated on WT TCRγδ+CD3+ CD27+ splenocytes. (g, h) Intracellular IFN-γ expression (after PMA and ionomycin stimulation) in TCRγδ+CD3+CD27+ splenocytes sorted 5 days after infection with Plasmodium berghei ANKA sporozoites. Numbers above plots indicate mean +/− s.d. absolute counts of IFN-γ+ γδ cells (g). Parasitemia as % blood GFP+ cells 5 days after infection (h). (i) Survival curves of n = 10 mice infected as in (g) in two independent experiments. Data in (a) and (e) are representative of n = 3 independent experiments. Error bars indicate s.d. of the mean and dots represent individual mice throughout. *P < 0.05, **P < 0.01 (Student’s t-test).

References

    1. Wang T, et al. IFN-gamma-producing gamma delta T cells help control murine West Nile virus infection. J Immunol. 2003;171:2524–2531. - PubMed
    1. Gao Y, et al. Gamma delta T cells provide an early source of interferon gamma in tumor immunity. J Exp Med. 2003;198:433–442. - PMC - PubMed
    1. Jagannathan P, et al. Loss and dysfunction of Vdelta2(+) gammadelta T cells are associated with clinical tolerance to malaria. Sci Transl Med. 2014;6:251ra117. - PMC - PubMed
    1. Cho JS, et al. IL-17 is essential for host defense against cutaneous Staphylococcus aureus infection in mice. J Clin Invest. 2010;120:1762–1773. - PMC - PubMed
    1. Sheridan BS, et al. gammadelta T cells exhibit multifunctional and protective memory in intestinal tissues. Immunity. 2013;39:184–195. - PMC - PubMed

Publication types

MeSH terms