. 2016 May;22(5):506-15.
doi: 10.1038/nm.4072. Epub 2016 Apr 4.

Epithelial calcineurin controls microbiota-dependent intestinal tumor development

Affiliations

Epithelial calcineurin controls microbiota-dependent intestinal tumor development

Kenneth Peuker et al. Nat Med. 2016 May.

Abstract

Inflammation-associated pathways are active in intestinal epithelial cells (IECs) and contribute to the pathogenesis of colorectal cancer (CRC). Calcineurin, a phosphatase required for the activation of the nuclear factor of activated T cells (NFAT) family of transcription factors, shows increased expression in CRC. We therefore investigated the role of calcineurin in intestinal tumor development. We demonstrate that calcineurin and NFAT factors are constitutively expressed by primary IECs and selectively activated in intestinal tumors as a result of impaired stratification of the tumor-associated microbiota and toll-like receptor signaling. Epithelial calcineurin supports the survival and proliferation of cancer stem cells in an NFAT-dependent manner and promotes the development of intestinal tumors in mice. Moreover, somatic mutations that have been identified in human CRC are associated with constitutive activation of calcineurin, whereas nuclear translocation of NFAT is associated with increased death from CRC. These findings highlight an epithelial cell-intrinsic pathway that integrates signals derived from the commensal microbiota to promote intestinal tumor development.


Conflict of interest statement

COMPETING FINANCIAL INTERESTS

The authors declare no competing financial interests.

Figures

Figure 1
Figure 1
Intestinal epithelial calcineurin promotes intestinal tumor development. (a–e) Number of total (a,d) and large (b,c,e) tumors in the small intestine of 18-week-old Cnb1ΔIEC;ApcMin/+ (n = 30) and Cnb1WT;ApcMin/+ (n = 24) littermates (a,b), the small intestine of 18-week-old Cnb1indΔIEC;ApcMin/+ (n = 9) and Cnb1WT;ApcMin/+ (n = 11) littermates after tamoxifen treatment (c), and the large intestine of Cnb1ΔIEC (n = 16) and Cnb1WT (n = 13) mice in the AOM-DSS model (d,e). (f,g) Quantification of cells staining positive for Ki-67 (f, left) or cleaved caspase-3 (cCasp-3) (g, left), using immunofluorescence, and representative images showing staining for Ki-67 (green) (f, middle and right), cCasp-3 (green) (g, middle and right) and DAPI (blue) in tumors from the small intestines of 18-week-old Cnb1WT;ApcMin/+ (middle; n = 21 for Ki-67; n = 14 for cCasp-3) and Cnb1ΔIEC;ApcMin/+ (right; n = 11 for Ki-67; n = 12 for cCasp-3) mice. Scale bars, 100 μm. The combined results of two (d,e) or three (c) independent experiments, or nine independent litters (a,b,f,g), are shown. In a–g, dots represent individual mice, and bar indicates median. P values were calculated using the Mann-Whitney U-test.
Figure 2
Figure 2
Calcineurin regulates tumor development through NFAT. (a) Representative images showing staining of the indicated NFAT family members in samples from humans with CRC (NFATc1, n = 28; NFATc2, n = 28; NFATc3, n = 704; NFATc4, n = 28). Arrows indicate tumor-infiltrating cells, which are delineated from tumors by dashed lines. Scale bar, 100 μm. (b) Representative western blot analysis (of two independent experiments) for expression of NFAT transcription factors in human CRC cell lines. β-actin was used as a loading control. (c) qPCR analysis for Nfatc3 expression in tumors (n = 10) or normal tissue (n = 10) from the small intestine of ApcMin/+ mice. (d) Representative immunohistochemical analysis (of three independent experiments) for expression of NFATc1 (top left), NFATc2 (top right), NFATc3 (bottom left) and NFATc4 (bottom right) in tumors from the small intestine of ApcMin/+ mice. Scale bar, 100 μm. (e) Representative immunofluorescence analysis (of three independent experiments) of NFATc3 (green) and DAPI (blue) in the normal mucosa (top) or tumors (bottom) of the small intestine of Cnb1WT;ApcMin/+ (left) or Cnb1ΔIEC;ApcMin/+ (right) mice. Large image on the left is a merged, magnified view of the smaller images on the right. Scale bars, 100 μm. (f,g) Number of large tumors in the small intestine of 18-week-old Nfatc3ΔIEC;ApcMin/+ (n = 23) and Nfatc3WT;ApcMin/+ (n = 25) mice (f) or in the large intestine of AOM-DSS-treated Nfatc3ΔIEC (n = 30) and Nfatc3WT (n = 39) mice (g). (h) Quantification of Ki-67+ cells (left) and representative images for Ki-67 (green) and DAPI (blue) staining (middle and right) in tumors from the small intestine of Nfatc3WT;ApcMin/+ (n = 9, middle) and Nfatc3 ΔIEC;ApcMin/+ (n = 6, right) mice. Scale bar, 100 μm. (i,j) Number of large (i,j, left) or total (j, right) tumors in the small intestine of Cnb1WT;ApcMin/+ mice and Cnb1ΔIEC;ApcMin/+ littermates after administration of Ad-NFATC3CA or Ad-LacZ, with (Ad-LacZ: Cnb1WT;ApcMin/+, n = 6; Ad-NFATC3CA: Cnb1WT;ApcMin/+, n = 10) or without (Ad-LacZ: Cnb1WT;ApcMin/+, n = 9; Cnb1ΔIEC;ApcMin/+, n = 10; Ad-NFATC3CA: Cnb1WT;ApcMin/+, n = 7; Cnb1ΔIEC;ApcMin/+, n = 9) antibiotics (i; see Online Methods), or of Cnb1WT;ApcMin/+ mice after administration of Ad-LacZ (n = 11 per group) or Ad-VIVIT (n = 12 per group) (j). In g,i,j, combined data for three (g), four (j) and six (i) independent experiments are shown. In all graphs, dots represent individual mice, and bar indicates median. P values were calculated using the Mann-Whitney U-test.
Figure 3
Figure 3
TLR stimulation promotes NFAT activation in CRC. (a,b) Representative calcium flux analysis (a) and electrophoretic mobility shift assays (EMSAs) for NFAT and/or NF-κB DNA-binding activity (b) in SW707 human CRC cells in response to agonists of TLR2 (Pam3CSK4), TLR3 (polyinosinic-polycytidylic acid; pIpC), TLR4 (LPS), TLR5 (flagellin) and TLR9 (Escherichia coli DNA). Treatment with PMA + ionomycin (iono) was used as a control. (c) Representative images of live-cell tracking analysis for ectopically expressed NFATc3–GFP in SW707 cells before (left) and 20 min after (right) LPS treatment. Scale bar, 1 μm. (d) Firefly luciferase expression, normalized to control Renilla luciferase expression, in SW707 cells after transfection of NFAT- or NF-κB–dependent luciferase reporter plasmids and in response to the indicated TLR agonists (n = 3 cultures per condition). Data are mean ± s.e.m. P values were calculated by one-way analysis of variance (ANOVA) followed by Dunnett’s test. (e,f) Representative EMSA analysis for NFAT DNA-binding activity in nuclear fractions of SW707 cells (e) or SW707 cells stably expressing a PPP3R1-specific shRNA or a nontargeting control (scramble) shRNA (f). (g) Time course for proliferation of SW707 cells stably expressing a PPP3R1-specific or NFATC3-specific shRNA, or a nontargeting control (scramble) shRNA, in the presence of LPS or vehicle (veh) (n = 3 cultures per condition). Data are mean ± s.e.m. P value was calculated by Student’s t-test. (h) Representative images (left and right) and quantification (bottom) of large organoids obtained from tumors of Cnb1ΔIEC;ApcMin/+ (vehicle-treated, n = 10; LPS-treated, n = 9) and Cnb1WT;ApcMin/+ mice (vehicle-treated, n = 9; LPS-treated, n = 10) after in vitro treatment with vehicle or LPS for 7 d. Circles in graph indicate individual organoid cultures, and the bar indicates median. Scale bar, 100 μm. P values were calculated by the Kruskal-Wallis test followed by Dunn’s test. Data in a–h are representative of three independent experiments.
Figure 4
Figure 4
Calcineurin-mediated tumor development is dependent on the microbiota. (a) Representative immunofluorescence images (of three independent experiments) for NFATc3 (green) and DAPI (blue) in tumors of the small intestine of ApcMin/+ mice (left) that were treated with vehicle (veh) (top left) or antibiotics (Abx) (bottom left) and Myd88−/−;ApcMin/+ mice (top right). Bottom right, quantification of NFATc3 nuclear translocation using the Pearson correlation coefficient in ApcMin/+ mice treated with vehicle (n = 5) or Abx (n = 11), and in Myd88−/−;ApcMin/+ mice (n = 5). P values were calculated by the Kruskal-Wallis test followed by Dunn’s test. Scale bars, 100 μm. (b) Luciferase expression, normalized to protein concentration, in tumors in the small intestine of Cnb1WT;ApcMin/+ mice administered Ad-LacZ (n = 8) or Ad–NFAT-Luc and treated with water (vehicle, n = 6) or antibiotics (n = 5), and in the small intestine of Cnb1ΔIEC;ApcMin/+ mice treated with water (n = 8) or antibiotics (n = 5) for 14 weeks (Online Methods). (c,d) Quantification of total (c) and large (d) tumors in the small intestine of Cnb1WT;ApcMin/+ mice after treatment with antibiotics (n = 13) or vehicle (n = 8), and in the small intestine of Cnb1ΔIEC;ApcMin/+ mice after treatment with antibiotics (n = 14) or vehicle (n = 10) for 14 weeks. In a–d, bar indicates the median, and dots represent individual mice. Combined results of two (a,b) or four (c,d) independent experiments are shown. P values in b–d were calculated by the Mann-Whitney U-test. (e) Constrained analysis of principle coordinates (‘capscale’; CAP)58 based on Bray-Curtis distances for Cnb1WT;ApcMin/+ mice (n = 7 for normal and tumor) and Cnb1ΔIEC;ApcMin/+ mice (n = 8 for normal and tumor). CAP1 separates normal intestinal mucosa (blue) and tumors (brown; double asterisk indicates adonis P = 0.003) but not genotypes (filled dots and circles; P > 0.05 in analysis of dissimilarity, ‘adonis’); MDS1 represents first nonconstrained axis after controlling the effect of tissues. (f) Species-level OTUs with differences between normal (n = 7) and tumor tissue (n = 7) of ApcMin/+ mice. The six OTUs with significant differences (Wilcoxon test P < 0.05 after correction for multiple testing) that were identified among the major OTUs (average relative abundance >0.5%) comprise Prevotella (top left), Lactobacillus (top middle), Escherichia and Shigella (top right), Tannerella (bottom left), Parabacteroides (bottom middle) and Citrobacter (bottom right). *P < 0.05; by the Wilcoxon test, after correction for multiple testing; boxes represent the 50% confidence interval; error bars represent the 95% confidence interval of the relative abundance, with the line in the box representing the mean value. (g) Relative abundance of Proteobacteria (left) and Enterobacteriaceae (right) in normal (n = 7) and tumor tissue (n = 7) of ApcMin/+ mice. Matched normal and tumor mucosa are shown in e–g.
Figure 5
Figure 5
Calcineurin and NFATc3 regulate cancer stem cells. (a) Representative immunofluorescence images (of three independent experiments) for NFATc3 (red), Lgr5–eGFP (green) and DAPI (blue) in tumors from Lgr5-EGFP-IRES-CreERT2;ApcMin/+ mice. Scale bar, 100 μm. (b) qPCR analysis for expression of the indicated genes in intestinal tumors from Cnb1WT;ApcMin/+ without (n = 7) or with antibiotics (n = 7) and from Cnb1ΔIEC;ApcMin/+ mice without (n = 5) or with antibiotics (n = 3). (c) Representative immunohistochemistry images (of three independent experiments) for DCLK1 in intestinal tumors from Cnb1WT;ApcMin/+ (left) and Cnb1ΔIEC;ApcMin/+ (right) mice. Scale bar, 100 μm. (d) qPCR analysis for the expression of the indicated genes in intestinal tumors from ApcMin/+ mice after administration of Ad-LacZ (n = 6) or Ad-VIVIT (n = 6) (Online Methods). (e,f) Relative numbers of eGFP+ cells (e) or the geometric mean of eGFP expression among gated eGFP+ cells (f) in intestinal tumors from Cnb1ΔIEC;ApcMin/+ (n = 7) and Cnb1WT;ApcMin/+ littermates (n = 16) on the Lgr5-EGFP-IRES-CreERT2 background. (g) Quantification of organoids derived from tumors of Cnb1WT;ApcMin/+ (n = 9) and Cnb1ΔIEC;ApcMin/+ mice (n = 10). (h) qPCR analysis for expression of the indicated genes after NFATc3 ChIP in intestinal tumors from Cnb1WT;ApcMin/+ (n = 5) and Cnb1ΔIEC;ApcMin/+ mice (n = 5). (i) qPCR analysis for expression of the indicated genes in sorted eGFP+ cells from intestinal tumors from Cnb1WT;ApcMin/+ (n = 10) and Cnb1ΔIEC;ApcMin/+ mice (n = 4) that were on the Lgr5-EGFP-IRES-CreERT2 background. (j) Representative immunohistochemistry images of β-catenin in intestinal tumors from Cnb1WT;ApcMin/+ (left) and Cnb1ΔIEC;ApcMin/+ (right) mice after administration of Ad-LacZ (top) or Ad-LGR5 (bottom) (Online Methods). Left graph shows normalized expression of firefly luciferase after transfection of a TCF- and LEF-dependent firefly luciferase construct and a control Renilla luciferase construct into SW707 cells stably expressing a PPP3R1-specific shRNA (n = 3) or a nontargeting control (scramble) shRNA (n = 3). Middle and right graphs show the number of total (middle) or large (right) organoids derived from tumors of Ad-LacZ–treated or Ad-LGR5–treated Cnb1ΔIEC;ApcMin/+ and Cnb1WT;ApcMin/+ littermates (n = 8 per group). Scale bar, 100 μm. Combined results of two (d–f,i) or three (b,h) independent experiments, or results representative of three independent experiments (a,c,g,j), are shown, with dots representing individual mice (b,d–f,h,i), organoid cultures (g,j middle and right graphs) or triplicate cultures (j, left graph). Bar indicates the mean (j left graph) or median (b,d–j, middle and right graphs). The Mann-Whitney U-test (d–i), the Student’s t-test (j, left graph) or the Kruskal-Wallis test followed by Dunn’s test (b,j middle and right graphs) was used to calculate P values.
Figure 6
Figure 6
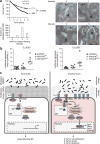
Activation of NFATc3 is associated with increased death from CRC. (a) Top left: Kaplan-Meier analysis of the survival (death from CRC) of individuals with CRC, plotted according to the nuclear staining intensity of NFATc3 in CRC tissue. Right: representative immunohistochemistry images of nuclear NFATc3 staining and scoring. Bottom left, quantification of CRC tissues according to the intensity of NFATc3 nuclear staining (0 (n = 16), 1 (n = 95), 2 (n = 412) or 3 (n = 181)). Arrows indicate stromal cells; arrowheads indicate tumor cells. Scale bar, 100 μm. The P value was calculated by the log-rank test. (b) Firefly luciferase expression, normalized to that of Renilla luciferase, after transfection of an NFAT-dependent firefly luciferase construct and either constructs expressing WT or mutant CnA-β or the empty plasmid (pcDNA3.1) into SW707 cells that were stably expressing a PPP3R1-specific shRNA (right) or a nontargeting control shRNA (left) (n = 7 per group). Dots represent individual cell cultures. Bar indicates the median. P values were calculated by the Mann-Whitney U-test. The results are representative of three independent experiments. (c) Schematic summary. In normal epithelium (left), limited TLR expression, and separation of the luminal microbiota from IECs prevents microbiota-induced calcineurin-dependent NFAT signaling. In intestinal tumors (right), increased TLR expression36, dysbiosis,, and impaired stratification of the luminal microbiota, allows for TLR-dependent, store-operated calcium entry via calcium release activated channels (CRACs). This leads to calcium-dependent calcineurin activation and NFAT-dependent transcription of stem cell–associated genes, which promote tumor proliferation and prevent apoptosis. AMPs, antimicrobial peptides; ER, endoplasmic reticulum; PLC-γ, phospholipase C gamma; MAMPs, microbe-associated molecular patterns; STIM1, stromal interaction molecule 1; IP3, inositol 1,4,5-trisphosphate.

Comment in

References

    1. Terzić J, Grivennikov S, Karin E, Karin M. Inflammation and colon cancer. Gastroenterology. 2010;138:2101–2114. - PubMed
    1. Bollrath J, et al. gp130-mediated Stat3 activation in enterocytes regulates cell survival and cell cycle progression during colitis-associated tumorigenesis. Cancer Cell. 2009;15:91–102. - PubMed
    1. Greten FR, et al. IKKβ links inflammation and tumorigenesis in a mouse model of colitis-associated cancer. Cell. 2004;118:285–296. - PubMed
    1. Grivennikov S, et al. IL-6 and Stat3 are required for survival of intestinal epithelial cells and development of colitis-associated cancer. Cancer Cell. 2009;15:103–113. - PMC - PubMed
    1. Grivennikov SI, et al. Adenoma-linked barrier defects and microbial products drive IL-23– and IL-17–mediated tumor growth. Nature. 2012;491:254–258. - PMC - PubMed

MeSH terms