. 2016 Mar 31;17(4):479.
doi: 10.3390/ijms17040479.

Different Serum Free Fatty Acid Profiles in NAFLD Subjects and Healthy Controls after Oral Fat Load

Affiliations

Different Serum Free Fatty Acid Profiles in NAFLD Subjects and Healthy Controls after Oral Fat Load

Roberto Gambino et al. Int J Mol Sci. .

Abstract

Background: Free fatty acid (FFA) metabolism can impact on metabolic conditions, such as obesity and nonalcoholic fatty liver disease (NAFLD). This work studied the increase in total FFA shown in NAFLD subjects to possibly characterize which fatty acids significantly accounted for the whole increase.

Methods: 21 patients with NAFLD were selected according to specified criteria. The control group consisted of nine healthy subjects. All subjects underwent an oral standard fat load. Triglycerides; cholesterol; FFA; glucose and insulin were measured every 2 h with the determination of fatty acid composition of FFA.

Results: higher serum FFA levels in NAFLD subjects are mainly due to levels of oleic, palmitic and linoleic acids at different times. Significant increases were shown for docosahexaenoic acid, linolenic acid, eicosatrienoic acid, and arachidonic acid, although this was just on one occasion. In the postprandial phase, homeostatic model assessment HOMA index positively correlated with the ω3/ω6 ratio in NAFLD patients.

Conclusions: the higher serum levels of FFA in NAFLD subjects are mainly due to levels of oleic and palmitic acids which are the most abundant circulating free fatty acids. This is almost exactly corresponded with significant increases in linoleic acid. An imbalance in the n-3/n-6 fatty acids ratio could modulate postprandial responses with more pronounced effects in insulin-resistant subjects, such as NAFLD patients.

Keywords: free fatty acids; insulin resistance; nonalcoholic fatty liver disease.


Figures
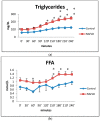
Figure 1
Figure 1
Time courses for total plasma triglycerides (box a) and free fatty acids (box b) concentrations during the oral fat meal in control (filled diamonds) and nonalcoholic fatty liver disease (NAFLD) (filled squares) subjects. Values are expressed as mean ±SEM. * p < 0.05, ** p < 0.01.
Figure 2
Figure 2
Time courses for glucose (box a) and insulin (box b) concentrations during the oral fat meal in control (filled diamonds) and NAFLD (filled squares) subjects. Values are expressed as mean ± SEM. * p < 0.05, ** p < 0.01.
Figure 3
Figure 3
Change in plasma levels of saturated lauric (box a), myristic (box b) and stearic (box c) acid during the oral fat meal in control (filled diamonds) and NAFLD (filled squares) subjects. Values are expressed as mean ± SEM.
Figure 4
Figure 4
Change in plasma levels of oleic + palmitic acid during the oral fat meal in control (filled diamonds) and NAFLD (filled squares) subjects. Values are expressed as mean ± SEM. * p < 0.05.
Figure 5
Figure 5
Change in plasma levels of palmitoleic (box a), linoleic (box b) eicosatrienoic (box c), DHA + linolenic (d) and arachidonic (e) acids during the oral fat meal in control (filled diamonds) and NAFLD (filled squares) subjects. Values are expressed as mean ± SEM. * p < 0.05, ** p < 0.01.
Figure 5
Figure 5
Change in plasma levels of palmitoleic (box a), linoleic (box b) eicosatrienoic (box c), DHA + linolenic (d) and arachidonic (e) acids during the oral fat meal in control (filled diamonds) and NAFLD (filled squares) subjects. Values are expressed as mean ± SEM. * p < 0.05, ** p < 0.01.
Figure 6
Figure 6
Correlation between homeostatic model assessment HOMA index and n-3/n-6 ratio at time 210 min in NAFLD patients (box 6a); correlation between HOMA index and n-3/n-6 ratio at time 240 min in NAFLD patients (box 6b); Figure 6a: PUFA n-3/n-6 at 210 min vs. HOMA in NAFLD; r = 0.54883, PUFA n-3/n-6 at 210 min; Figure 6b: PUFA n-3/n-6 at 240 min vs. HOMA in NAFLD; r = 0.47351, PUFA n-3/n-6 at 240 min.
Figure 6
Figure 6
Correlation between homeostatic model assessment HOMA index and n-3/n-6 ratio at time 210 min in NAFLD patients (box 6a); correlation between HOMA index and n-3/n-6 ratio at time 240 min in NAFLD patients (box 6b); Figure 6a: PUFA n-3/n-6 at 210 min vs. HOMA in NAFLD; r = 0.54883, PUFA n-3/n-6 at 210 min; Figure 6b: PUFA n-3/n-6 at 240 min vs. HOMA in NAFLD; r = 0.47351, PUFA n-3/n-6 at 240 min.

References

    1. Kooner J.S., Baliga R.R., Wilding J., Crook D., Packard C.J., Banks L.M., Peart S., Aitman T.J., Scott J. Abdominal obesity, impaired nonesterified fatty acid suppression, and insulin-mediated glucose disposal are early metabolic abnormalities in families with premature myocardial infarction. Arterioscler. Thromb. Vasc. Biol. 1998;18:1021–1026. doi: 10.1161/01.ATV.18.7.1021. - DOI - PubMed
    1. Zoratti R., Godsland I.F., Chaturvedi N., Crook D., Crook D., Stevenson J.C., McKeigue P.M. Relation of plasma lipids to insulin resistance, nonesterified fatty acid levels, and body fat in men from three ethnic groups: Relevance to variation in risk of diabetes and coronary disease. Metabolism. 2000;49:245–252. doi: 10.1016/S0026-0495(00)91507-5. - DOI - PubMed
    1. Musso G., Gambino R., Cassader M. Recent insights into hepatic lipid metabolism in non-alcoholic fatty liver disease (NAFLD) Prog. Lipid Res. 2009;48:1–26. doi: 10.1016/j.plipres.2008.08.001. - DOI - PubMed
    1. Musso G., Gambino R., de Michieli F., Biroli G., Fagà E., Pagano G., Cassader M. Association of liver disease with postprandial large intestinal triglyceride-rich lipoprotein accumulation and pro/antioxidant imbalance in normolipidemic non-alcoholic steatohepatitis. Ann. Med. 2008;40:383–394. doi: 10.1080/07853890801946515. - DOI - PubMed
    1. De Almeida I.T., Cortez-Pinto H., Fidalgo G., Rodrigues D., Camilo M.E. Plasma total and free fatty acids composition in human non-alcoholic steatohepatitis. Clin. Nutr. 2002;21:219–223. doi: 10.1054/clnu.2001.0529. - DOI - PubMed

Publication types