

Genetic, Ecological and Morphological Distinctness of the Blue Mussels Mytilus trossulus Gould and M. edulis L. in the White Sea
- PMID: 27044013
- PMCID: PMC4820271
- DOI: 10.1371/journal.pone.0152963
Genetic, Ecological and Morphological Distinctness of the Blue Mussels Mytilus trossulus Gould and M. edulis L. in the White Sea
Abstract
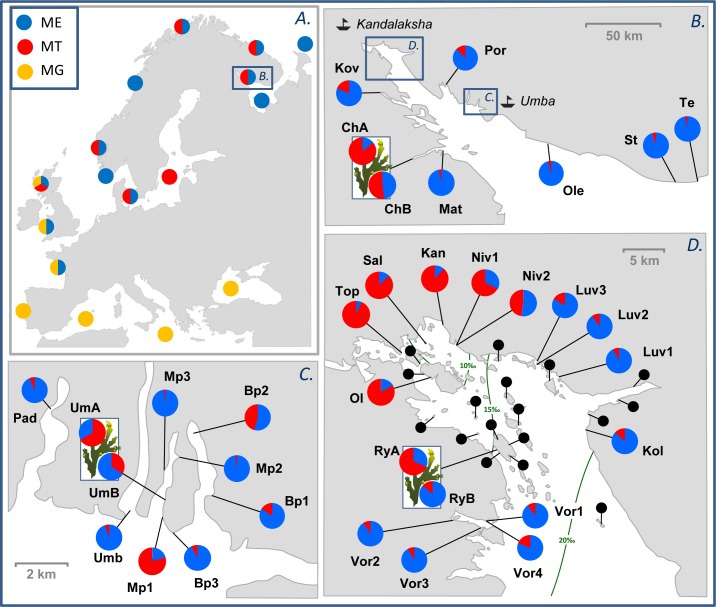
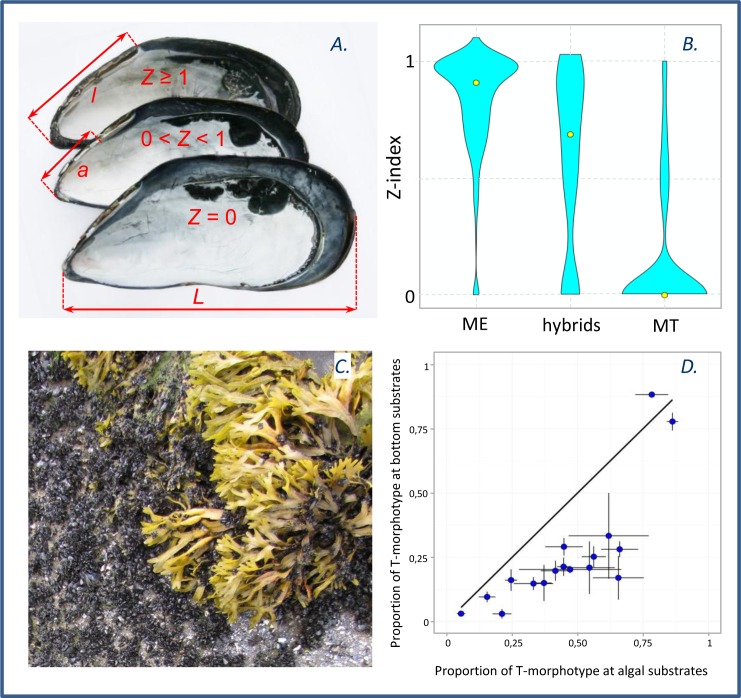
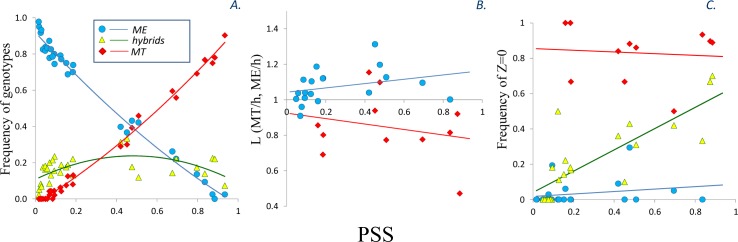
Two blue mussel lineages of Pliocene origin, Mytilus edulis (ME) and M. trossulus (MT), co-occur and hybridize in several regions on the shores of the North Atlantic. The two species were distinguished from each other by molecular methods in the 1980s, and a large amount of comparative data on them has been accumulated since that time. However, while ME and MT are now routinely distinguished by various genetic markers, they tend to be overlooked in ecological studies since morphological characters for taxonomic identification have been lacking, and no consistent habitat differences between lineages have been reported. Surveying a recently discovered area of ME and MT co-occurrence in the White Sea and employing a set of allozyme markers for identification, we address the issue whether ME and MT are true biological species with distinct ecological characteristics or just virtual genetic entities with no matching morphological and ecological identities. We find that: (1) in the White Sea, the occurrence of MT is largely concentrated in harbors, in line with observations from other subarctic regions of Europe; (2) mixed populations of ME and MT are always dominated by purebred individuals, animals classified as hybrids constituting only ca. 18%; (3) in terms of shell morphology, 80% of MT bear a distinct uninterrupted dark prismatic strip under the ligament while 97% of ME lack this character; (4) at sites of sympatry MT is more common on algal substrates while ME mostly lives directly on the bottom. This segregation by the substrate may contribute to maintaining reproductive isolation and decreasing competition between taxa. We conclude that while ME and MT are not fully reproductively isolated, they do represent clearly distinguishable biological, ecological and morphological entities in the White Sea. It remains to be documented whether the observed morphological and ecological differences are of a local character, or whether they have simply been overlooked in other contact zones.
Conflict of interest statement
Figures
Similar articles
-
Discriminating Eaters: Sea Stars Asterias rubens L. Feed Preferably on Mytilus trossulus Gould in Mixed Stocks of Mytilus trossulus and Mytilus edulis L.Biol Bull. 2018 Apr;234(2):85-95. doi: 10.1086/697944. Epub 2018 May 7. Biol Bull. 2018. PMID: 29856669
-
Species identification based on a semi-diagnostic marker: Evaluation of a simple conchological test for distinguishing blue mussels Mytilus edulis L. and M. trossulus Gould.PLoS One. 2021 Jul 23;16(7):e0249587. doi: 10.1371/journal.pone.0249587. eCollection 2021. PLoS One. 2021. PMID: 34297723 Free PMC article.
-
Local adaptation and species segregation in two mussel (Mytilus edulis x Mytilus trossulus) hybrid zones.Mol Ecol. 2005 Feb;14(2):381-400. doi: 10.1111/j.1365-294X.2004.02379.x. Mol Ecol. 2005. PMID: 15660932 Review.
-
Single nucleotide polymorphisms in native South American Atlantic coast populations of smooth shelled mussels: hybridization with invasive European Mytilus galloprovincialis.Genet Sel Evol. 2018 Feb 22;50(1):5. doi: 10.1186/s12711-018-0376-z. Genet Sel Evol. 2018. PMID: 29471805 Free PMC article.
-
Mytilus hybridisation and impact on aquaculture: A minireview.Mar Genomics. 2016 Jun;27:3-7. doi: 10.1016/j.margen.2016.04.008. Epub 2016 May 2. Mar Genomics. 2016. PMID: 27157133 Review.
Cited by
-
In vitro proliferation of Mytilus edulis male germ cell progenitors.PLoS One. 2024 Feb 9;19(2):e0292205. doi: 10.1371/journal.pone.0292205. eCollection 2024. PLoS One. 2024. PMID: 38335194 Free PMC article.
-
Replicated anthropogenic hybridisations reveal parallel patterns of admixture in marine mussels.Evol Appl. 2019 Nov 22;13(3):575-599. doi: 10.1111/eva.12879. eCollection 2020 Mar. Evol Appl. 2019. PMID: 32431737 Free PMC article.
-
Structure, Evolution, and Mitochondrial Genome Analysis of Mussel Species (Bivalvia, Mytilidae).Int J Mol Sci. 2024 Jun 24;25(13):6902. doi: 10.3390/ijms25136902. Int J Mol Sci. 2024. PMID: 39000014 Free PMC article.
-
The Mediterranean Mussel Mytilus galloprovincialis (Mollusca: Bivalvia) in Chile: Distribution and Genetic Structure of a Recently Introduced Invasive Marine Species.Animals (Basel). 2024 Mar 7;14(6):823. doi: 10.3390/ani14060823. Animals (Basel). 2024. PMID: 38539921 Free PMC article.
-
DNA barcodes of Antipode marine invertebrates in Bay of Biscay and Gulf of Lion ports suggest new biofouling challenges.Sci Rep. 2018 Nov 1;8(1):16214. doi: 10.1038/s41598-018-34447-y. Sci Rep. 2018. PMID: 30385812 Free PMC article.
References
-
- Mayr E, Aschlock PD. Principles of Systematic Zoology. New York: McGraw-Hill; 1991.
-
- Knowlton N. Sibling species in the sea. Annu Rev Ecol Syst. 1993; 24: 189–216.
-
- Sáez AG, Lozano E. Body doubles. Nature. 2005; 433:111 - PubMed
-
- Koehn RK, Hall JG, Innes DJ, Zera A. Genetic differentiation of Mytilus edulis in eastern North America. Mar Biol. 1984; 79:117–126.
-
- Varvio SL, Koehn RK, Väinölä R. Evolutionary genetics of the Mytilus edulis complex in the North Atlantic region. Mar Biol. 1988; 98:51–60.
Publication types
MeSH terms
LinkOut - more resources
Full Text Sources
Other Literature Sources
