. 2016 Apr 19;113(16):E2241-7.
doi: 10.1073/pnas.1520288113. Epub 2016 Apr 4.

Population size does not explain past changes in cultural complexity

Affiliations

Population size does not explain past changes in cultural complexity

Krist Vaesen et al. Proc Natl Acad Sci U S A. .

Abstract

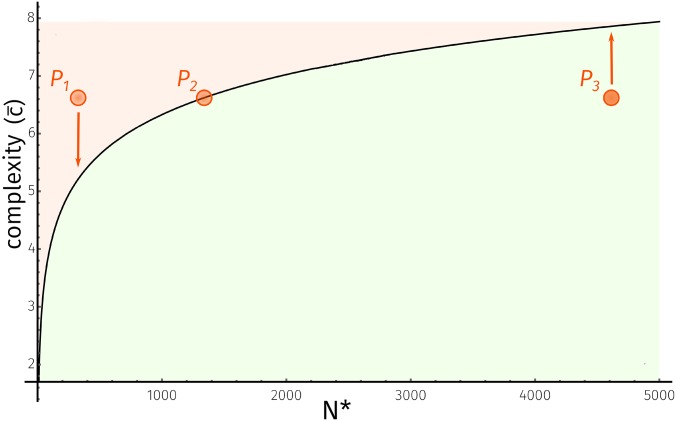
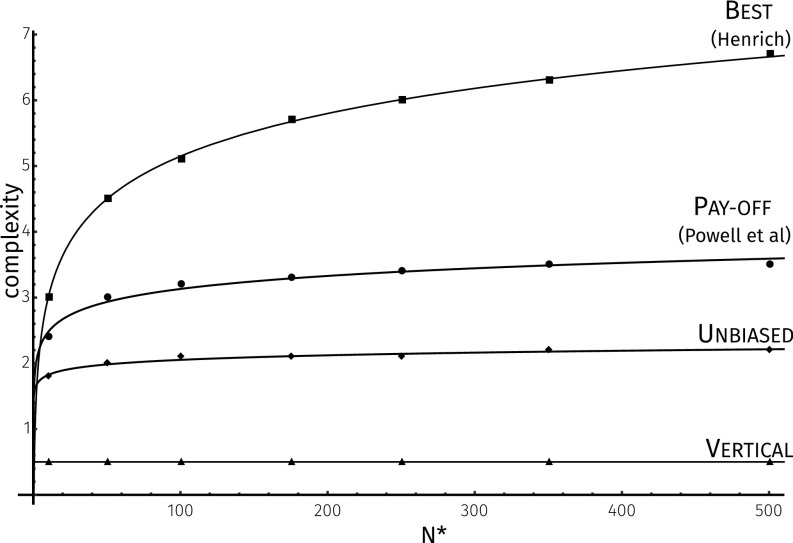
Demography is increasingly being invoked to account for features of the archaeological record, such as the technological conservatism of the Lower and Middle Pleistocene, the Middle to Upper Paleolithic transition, and cultural loss in Holocene Tasmania. Such explanations are commonly justified in relation to population dynamic models developed by Henrich [Henrich J (2004)Am Antiq69:197-214] and Powell et al. [Powell A, et al. (2009)Science324(5932):1298-1301], which appear to demonstrate that population size is the crucial determinant of cultural complexity. Here, we show that these models fail in two important respects. First, they only support a relationship between demography and culture in implausible conditions. Second, their predictions conflict with the available archaeological and ethnographic evidence. We conclude that new theoretical and empirical research is required to identify the factors that drove the changes in cultural complexity that are documented by the archaeological record.

Keywords: Tasmania; Upper Paleolithic transition; cultural complexity; cultural evolution; demography.


Conflict of interest statement

The authors declare no conflict of interest.

Figures

Fig. S1.
Fig. S1.
Transmission process as assumed by Henrich (11), for a population of size n = 5. A generation of offspring (o1, o2, o3, o4, o5) learns from the best parent in the previous generation, namely p3, who has a skill level, z, of 1.0. The skill in question is complex to the extent, c¯, that corresponds to the average error learners are expected to make while attempting to imitate p3. To determine the individual error of each offspring, one draws a random number from the distribution centered around zp3c¯. The larger the population, the more likely it is that an individual in the offspring generation will perform as well as or better than p3 (i.e., end up in the green area to the right of p3). The best offspring individual will serve as a parent for the subsequent offspring generation.
Fig. S2.
Fig. S2.
Illustration of Complexity Regression. The curve on each plot represents the relationship predicted by the formal models, namely, a correlation between cultural complexity and N*, which is the minimal population size needed for a population not to incur loss of skill. Thus, the curve forms the boundary between two regimes: regimes of increasing (green) and decreasing (red) skill levels. First, the size of the population is reduced, so that it now experiences a decline in skill levels. For such demographic change to result in lower levels of cultural complexity (y axis), one needs an additional assumption (i.e., Complexity Regression): that the population in question will revert to simpler skills, following the arrow downward. One can see Complexity Regression at work in figure 2 of ref. (more specifically, the horizontal arrow) and in the accompanying description of ref. (p. 203). Pt0, population at timestep 0; Pt1, population at timestep 1.
Fig. S3.
Fig. S3.
Illustration of Complexity Maximization. The curve on the plot represents the relationship predicted by the formal models, namely, a correlation between cultural complexity and N*, which is the minimal population size needed for a population not to incur loss of skill. Thus, the curve forms the boundary between two regimes: regimes of increasing (green) and decreasing (red) skill levels. Population growth first brings the population into a regime of increasing skillfulness. Subsequently, per Complexity Maximization, the population will invent and adopt more complex skills (following the arrow upward).
Fig. S4.
Fig. S4.
Illustration of Complexity Optimization. The curve on the plot represents the relationship predicted by the formal models, namely, a correlation between cultural complexity and N*, which is the minimal population size needed for a population not to incur loss of skill. Thus, the curve forms the boundary between two regimes: regimes of increasing (green) and decreasing (red) skill levels. To get a general association between population size and complexity, populations must adopt Complexity Regression (arrow downward) when in a regime of decreasing skillfulness and Complexity Regression (arrow upward) when in a regime of increasing skill levels. Social learners must thus optimize complexity, achieving a level of complexity that is neither too high nor too low.
Fig. 1.
Fig. 1.
Cultural complexity vs. critical population size N* (the minimal population size needed for a population not to incur skillfulness loss) for various biases (described in the main text).
Fig. S5.
Fig. S5.
Estimated effective population sizes for Homo sapiens [borrowed by Powell et al. (12) from Atkinson et al. (63)]. The orange lines indicate estimated dates for the Upper Paleolithic transition [estimates were taken from Powell et al. (12)]. According to the model of Powell et al. (12), populations should accumulate complexity whenever their size increases. This prediction is violated in the following ways. Concerning Sub-Saharan Africa, populations grow steadily from 160 kya onward, yet the transition to full modern human behavior appears only around 90–75 kya, and the package of modern human behavior disappears, despite population growth, between 75 and 40 kya. Population growth in Northern and Central Asia starts ∼55 kya, whereas the onset of the Upper Paleolithic transition is around ∼43 kya; the full package of modern human behavior evolves only 22 kya. Southern Asian populations increase very markedly from 55–45 kya, after which they stabilize; it is in the latter period, not during expansion, that the Upper Paleolithic transition takes place. In Australia, the transition starts fairly suddenly ∼20 kya, much after the pronounced population increase 50–45 kya. Adapted from ref. (Atkinson et al.) (Copyright 2008, Oxford University Press).
Fig. S6.
Fig. S6.
Inference of population size from whole-genome sequences. Population size estimates from four haplotypes (two phased individuals) (A) and eight haplotypes (four phased individuals) (B) from each of nine populations. Based on A, the supposed full package of modern behavior would first appear in Africa at a time when populations were shrinking (90–75 kya). Based on B, the Upper Paleolithic transition would arrive in Europe at the start of a long period of historically low population numbers. Finally, the curves for Asia and Europe follow a trajectory that is almost identical, which conflicts with the variation between these two regions as regards the timing of the Upper Paleolithic transition. Adapted from ref. (Schiffels and Durbin) (Copyright 2014, Macmillan Publishers Ltd.).

Comment in

  • Understanding cumulative cultural evolution.
    Henrich J, Boyd R, Derex M, Kline MA, Mesoudi A, Muthukrishna M, Powell AT, Shennan SJ, Thomas MG. Henrich J, et al. Proc Natl Acad Sci U S A. 2016 Nov 1;113(44):E6724-E6725. doi: 10.1073/pnas.1610005113. Epub 2016 Oct 25. Proc Natl Acad Sci U S A. 2016. PMID: 27791123 Free PMC article. No abstract available.
  • Reply to Henrich et al.: The Tasmanian effect and other red herrings.
    Vaesen K, Collard M, Cosgrove R, Roebroeks W. Vaesen K, et al. Proc Natl Acad Sci U S A. 2016 Nov 1;113(44):E6726-E6727. doi: 10.1073/pnas.1613074113. Epub 2016 Oct 25. Proc Natl Acad Sci U S A. 2016. PMID: 27791150 Free PMC article. No abstract available.

References

    1. Childe VG. Man Makes Himself. Watts; London: 1936.
    1. Binford LR. Post-Pleistocene adaptations. In: Binford SR, Binford LR, editors. New Perspectives in Archeology. Aldine; Chicago: 1968. pp. 313–341.
    1. Renfrew C. Before Civilisation. Knopf; New York: 1973.
    1. Earle TK. A model of subsistence change. In: Earle TK, Christenson AL, editors. Modeling Change in Prehistoric Subsistence Economies. Academic; New York: 1980. pp. 1–29.
    1. Redding RW. A general explanation of subsistence change: From hunting and gathering to food production. J Anthropol Archaeol. 1988;7(1):56–97.

Publication types

LinkOut - more resources