. 2016 Apr 19;113(16):E2231-40.
doi: 10.1073/pnas.1522556113. Epub 2016 Apr 4.

Real-time monitoring of metabolic function in liver-on-chip microdevices tracks the dynamics of mitochondrial dysfunction

Affiliations

Real-time monitoring of metabolic function in liver-on-chip microdevices tracks the dynamics of mitochondrial dysfunction

Danny Bavli et al. Proc Natl Acad Sci U S A. .

Abstract

Microfluidic organ-on-a-chip technology aims to replace animal toxicity testing, but thus far has demonstrated few advantages over traditional methods. Mitochondrial dysfunction plays a critical role in the development of chemical and pharmaceutical toxicity, as well as pluripotency and disease processes. However, current methods to evaluate mitochondrial activity still rely on end-point assays, resulting in limited kinetic and prognostic information. Here, we present a liver-on-chip device capable of maintaining human tissue for over a month in vitro under physiological conditions. Mitochondrial respiration was monitored in real time using two-frequency phase modulation of tissue-embedded phosphorescent microprobes. A computer-controlled microfluidic switchboard allowed contiguous electrochemical measurements of glucose and lactate, providing real-time analysis of minute shifts from oxidative phosphorylation to anaerobic glycolysis, an early indication of mitochondrial stress. We quantify the dynamics of cellular adaptation to mitochondrial damage and the resulting redistribution of ATP production during rotenone-induced mitochondrial dysfunction and troglitazone (Rezulin)-induced mitochondrial stress. We show troglitazone shifts metabolic fluxes at concentrations previously regarded as safe, suggesting a mechanism for its observed idiosyncratic effect. Our microfluidic platform reveals the dynamics and strategies of cellular adaptation to mitochondrial damage, a unique advantage of organ-on-chip technology.

Keywords: liver tissue engineering; microfluidics; organ-on-a-chip; toxicology.


Conflict of interest statement

The authors declare no conflict of interest.

Figures

Fig. 1.
Fig. 1.
(A) Schematic of glucose and glutamine utilization by central carbon metabolism. Theoretically, mitochondrial dysfunction will lead to a decrease in oxygen uptake and increase in lactate production due to cellular shift from oxidative phosphorylation (purple) to glycolysis (orange). (B) Scheme of the measurement setup. Bioreactor was loaded with tissue-embedded oxygen sensors and mounted on an Olympus IX83. OPAL unit controlled LED signal modulation, exciting the oxygen sensors, and analyzed the signal through the photomultiplier readout. Bioreactor outflow was connected to a microfluidic switchboard containing a series of pressure-controlled micromechanical valves. The switchboard introduced samples into a sensor unit containing electrochemical sensors for glucose and lactate. Sensors were controlled by a potentiostat (PSTAT). Optical, pressure, and electronic sensors were connected to a single microprocessor that synchronized the signal. (C) Jablonski diagram describing the generation of phosphorescence with Ru-CPOx beads under the influence of oxygen. The quenching of the phosphorescence by triplet oxygen leads to a decrease in signal intensity and phosphorescence decay time (T1). (D) The effect described in C induces a phase shift between the intensity-modulated excitation and emission light. Thus, the degree of phase shift can be used for determining the oxygen concentration. Two-superimposed frequencies were used to screen out background interference. (E) Design of amperometric sensor in two-electrode configuration. Anodic oxidation of H2O2 on the platinum working-electrode (WE) held at 450 mV against the reference electrode (REF/CE) produces a detected current. (F) H2O2 is created in equivalent amounts of the analyte as an intermediate product by the activity of glucose oxidase (GOx) or lactate oxidase (LOx).
Fig. 2.
Fig. 2.
(A) Explosive view of bioreactor components. From bottom to top: PMMA housing, cover glass, laser-cut PDMS microwells, top glass window, and PMMA cover. (B) Photo of assembled bioreactor on microscope stage. (C) Composite tile scan image of HepG2/C3A organoid after overnight incubation with embedded oxygen-sensing microprobes (orange). (D) Numerical simulation of the pressure drop and variations in oxygen concentration throughout the bioreactor. (E) Cross-section of oxygen gradient developing due to consumption within the well (from top to bottom), mimicking the in vivo microenvironment. (Right) Gradients of glucose and lactate concentrations within the well. (F) Representative long-term oxygen measurement over 1 mo in bioreactor perfused with cell culture medium at 2 µL/min. One hundred percent air represents atmospheric dissolved oxygen concentration (no consumption). Cultures reach steady state within 4 d after seeding. (G) Log-scale quantitative gene expression analysis of HepG2/C3A cells in static culture compared with those perfused with 1% DMSO for 30 d (growth arrest). PXR, CYP3A4 and CYP2C9 expression shows a 10-, 58-, and 300-fold increase in the bioreactor, respectively (P < 0.024, n = 3). Values are within 10–30% of primary human hepatocytes. *P < 0.05 by Student’s t test.
Fig. 3.
Fig. 3.
(A) Representative oxygen uptake over time response of HepG2/C3A cells exposed to increasing concentrations of rotenone. (B) Dose dependence of rotenone after 12 h. TC50 was calculated to be 12.5 µM. (C) TUNEL staining shows 14-fold increase in apoptosis following 24 h exposure to 200 µM rotenone (P < 0.001, n = 5), as well as unlabeled cell death, suggesting necrosis. (D) Representative oxygen uptake over time response of HepG2/C3A cells exposed to increasing concentrations of troglitazone. (E) Dose dependence of troglitazone after 24 h. TC50 was calculated to be 285 µM. (F) CDFDA staining shows 4.5-fold increase in intracellular accumulation of bile acids (cholestasis) following 24-h exposure to 200 µM troglitazone (P < 0.001, n = 5). (G) IVIVC curve comparing TC50 values of primary human hepatocytes to our bioreactor showing an excellent R2 = 0.99 correlation for acetaminophen, amiodarone, troglitazone, and rotenone. (H) Time to onset of mitochondrial damage was dose dependent for both rotenone (Left) and troglitazone (Right), occurring in minutes rather than hours following exposure to the drugs. (I) OCR measured on isolated mitochondria for 30 min, followed by ADP injection (arrow) and subsequent injection of 50 µM rotenone (Left) or troglitazone (Right). Loss of OCR was immediate (P < 0.001, n = 3) and did not require cytosolic enzyme activation of the drugs. **P < 0.01 by Student’s t test.
Fig. 4.
Fig. 4.
(A) Photo of PMMA unit housing both glucose and lactate sensors with total internal volume of 26 µL. (B) Amperometric calibration curves of glucose and lactate sensors in the PMMA housing. Measurements were carried out under static condition for 100–200 s. Air purging before sample introduction ensured sharp change in chemical gradient. (C) Photo of two-layer microfluidic switchboard containing flow channels (red) and independently addressed control channels (blue). (D) Characterization of micromechanical valve switching pressure as a function of number of cycles (age). Valves withstand over 15,000 cycles without loss of sensitivity, up to 300 d of continuous operation. (E) Schematic of microfluidic switchboard connectivity and operating sequence. Switchboard contained inputs to air, washing buffer (PBS), and calibration solution. Bioreactors outflow was split to high-resistance waste (W) and normally closed channel to switchboard. Air purging was carried out for 4 s before and after measurement or calibration step. A total of 200 s of washing intersected between measurements. (F) Images of perfusion sequence starting with a washing step (blue), air purging, and sample introduction (red). (G) Photo of simplified setup where a single bioreactor is connected to the switchboard. (H) Automatic amperometric calibration and measurement of glucose concentration in bioreactor outflow.
Fig. S1.
Fig. S1.
(A) Images of HepG2/C3A cells stained for PAS and hematoxylin following 12-h exposure to drugs. (B) Glycogen content was unchanged between the three conditions.
Fig. S2.
Fig. S2.
(A) Glutamine uptake (outlet–inlet) in HepG2/C3A bioreactors exposed to 50 μM troglitazone or rotenone (dotted arrow). Rotenone exposure caused an increase in glutamine uptake, whereas troglitazone increase was more muted. (B) Glutamine uptake rate, averaged over 3–6 h, during exposure to troglitazone, rotenone, or control.
Fig. 5.
Fig. 5.
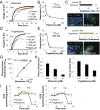
(A) Composite tile scan image of live/dead staining of HepG2/C3A organoids in bioreactors treated for 24 h with 50 or 200 µM rotenone. Approximately 15% of the cells died following exposure to 50 µM rotenone. (B) Representative curves of oxygen uptake, glucose uptake, and lactate production of HepG2/C3A cells following exposure to 50 µM rotenone (dotted line). Glucose uptake is shown as inlet–outlet concentration (red circles), whereas lactate production is shown as outlet–inlet concentration (green squares). (C) Changes in lactate over glucose ratio following exposure to rotenone (dotted line). Ratio shifts from 1.5 to 2.6 within 3 h after exposure, indicating a shift from oxidative phosphorylation to glycolysis. Ratio spirals to 6.1 after 6 h exposure followed by increase in cell death. (D) Composite tile scan image of live/dead staining of HepG2/C3A organoids in bioreactors treated for 24 h with 50 or 200 µM troglitazone. Less than 5% of the cells died following exposure to 50 µM troglitazone, not significantly different from control. (E) Representative curves of oxygen uptake, glucose uptake, and lactate production of HepG2/C3A cells following exposure to 50 µM troglitazone (dotted line). (F) Changes in lactate over glucose ratio following exposure to troglitazone (dotted line). Ratio gradually shifts from 1.3 to 1.8 within 6 h after exposure, indicating a shift from oxidative phosphorylation to glycolysis. (G) Relative ATP production rate calculated from flux balance analysis (Table 1; Methods), juxtaposed with experimentally measured ATP/ADP ratio in troglitazone-, rotenone-, and vehicle-treated cells. Rotenone-treated cells show 47% decrease in ATP/ADP ratio (P < 0.001, n = 3), whereas troglitazone-treated cells show no significant difference despite the metabolic shift. (H) Diverging metabolic sources of ATP production in untreated cells (normal), troglitazone-treated cells (mitochondrial stress), and rotenone-treated cells (mitochondrial dysfunction) presented as pie charts of relative diameter.
Fig. 6.
Fig. 6.
(A) Live staining of HepG2/C3A cells with JC1 dye following exposure to 50 µM rotenone (Upper) or troglitazone (Lower). (B) Rotenone causes significant increase in MMP after 3 h of exposure (P < 0.001. n = 3). Troglitazone causes a gradual increase in MMP along 6 h of exposure (P < 0.001, n = 3). (C) Direct measurement of OCR using a Seahorse XF24 analyzer on HepG2/C3A cells exposed to 50 µM troglitazone, rotenone, or vehicle control. Basal respiration (blue) was measured for 30 min, showing significant differences between the three conditions (P < 0.001, n = 3). Oligomycin was injected at 30 min, blocking ATP production due to oxidative phosphorylation (red). FCCP was injected at 60 min, followed by complex I and III inhibitors at 90 min, showing differences in maximal mitochondrial capacity (green). (D) Troglitazone induced 20 ± 6% decrease in basal metabolic rate (P < 0.01, n = 3) and a 22 ± 9% decrease in maximal mitochondrial capacity (P < 0.05, n = 3) following FCCP injection. Rotenone induced 85 ± 5% decrease in oxidative phosphorylation (P < 0.001, n = 3) and 83%, 87% in basal and maximal capacity as well. Glutamine oxidation rate (glutaminolysis) is juxtaposed to the right showing nonsignificant 26 ± 30% increase following troglitazone treatment, but a 382 ± 115% increase due to rotenone exposure (P < 0.03, n = 3). (E) Extracellular acidification rate (ECAR), a surrogate measure of lactate production, increased by 43 ± 43% in troglitazone-treated cells, and decreased 21 ± 12% in rotenone-treated cells (P > 0.17, n = 3). *P < 0.05, **P < 0.001 by Student’s t test.
Fig. 7.
Fig. 7.
Schematics depicting the metabolic response of liver cells to troglitazone-induced mitochondrial stress and rotenone-induced mitochondrial dysfunction compared with untreated controls. Down-regulated fluxes are shown in green, up-regulated fluxes are shown in red. Numbers reflect measured changes in glucose, lactate, and oxygen uptake.

References

    1. Huh D, et al. Reconstituting organ-level lung functions on a chip. Science. 2010;328(5986):1662–1668. - PMC - PubMed
    1. Monga SP, et al. Mouse fetal liver cells in artificial capillary beds in three-dimensional four-compartment bioreactors. Am J Pathol. 2005;167(5):1279–1292. - PMC - PubMed
    1. Allen JW, Bhatia SN. Formation of steady-state oxygen gradients in vitro: Application to liver zonation. Biotechnol Bioeng. 2003;82(3):253–262. - PubMed
    1. Khademhosseini A, et al. Cell docking inside microwells within reversibly sealed microfluidic channels for fabricating multiphenotype cell arrays. Lab Chip. 2005;5(12):1380–1386. - PubMed
    1. Sivaraman A, et al. A microscale in vitro physiological model of the liver: Predictive screens for drug metabolism and enzyme induction. Curr Drug Metab. 2005;6(6):569–591. - PubMed

Publication types

MeSH terms