. 2016 Apr 5:15:58.
doi: 10.1186/s12934-016-0456-0.

Diversity of flux distribution in central carbon metabolism of S. cerevisiae strains from diverse environments

Affiliations

Diversity of flux distribution in central carbon metabolism of S. cerevisiae strains from diverse environments

Thibault Nidelet et al. Microb Cell Fact. .

Abstract

Background: S. cerevisiae has attracted considerable interest in recent years as a model for ecology and evolutionary biology, revealing a substantial genetic and phenotypic diversity. However, there is a lack of knowledge on the diversity of metabolic networks within this species.

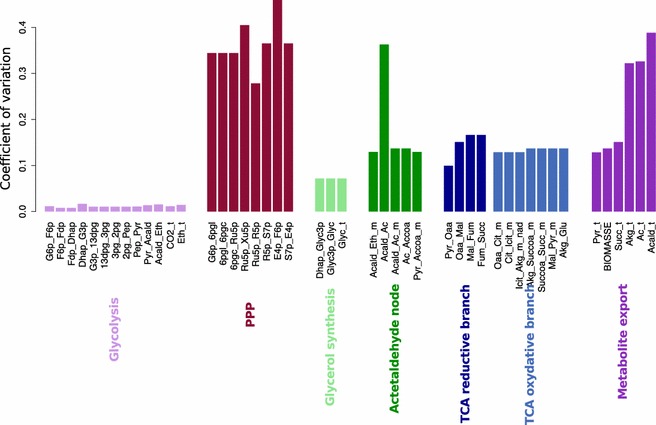
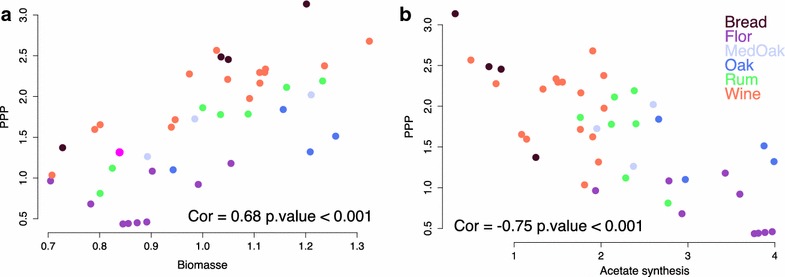
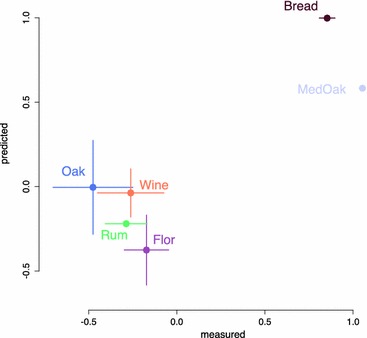
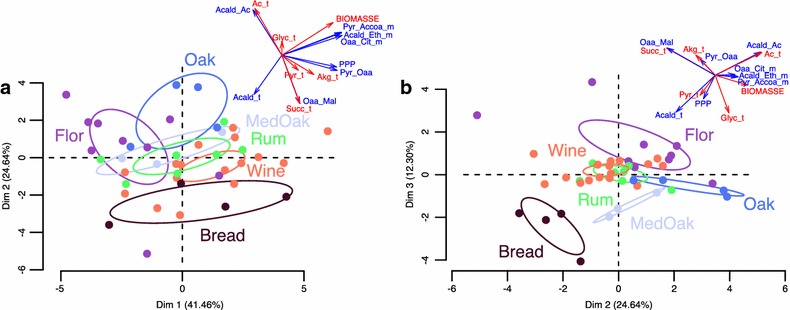
Results: To identify the metabolic and evolutionary constraints that shape metabolic fluxes in S. cerevisiae, we used a dedicated constraint-based model to predict the central carbon metabolism flux distribution of 43 strains from different ecological origins, grown in wine fermentation conditions. In analyzing these distributions, we observed a highly contrasted situation in flux variability, with quasi-constancy of the glycolysis and ethanol synthesis yield yet high flexibility of other fluxes, such as the pentose phosphate pathway and acetaldehyde production. Furthermore, these fluxes with large variability showed multimodal distributions that could be linked to strain origin, indicating a convergence between genetic origin and flux phenotype.

Conclusions: Flux variability is pathway-dependent and, for some flux, a strain origin effect can be found. These data highlight the constraints shaping the yeast operative central carbon network and provide clues for the design of strategies for strain improvement.

Keywords: Diversity; Flux balance analysis; Metabolic flux; Modeling; S. cerevisiae.


Figures

Fig. 1
Fig. 1
Schematic representation and distributions of fluxes in central carbon metabolism. Schematic representation of the average flux of 43 strains. The colors of the lines are representative of the average flux values across all strains expressed as a percentage of the glucose input and represented by a gradient of color from yellow to red. The average flux values ± the standard deviation are indicated by blue numbers for selected and representative reactions. Distribution of flux values for several selected reactions (an). The fluxes are normalized by the average flux of each reaction and therefore are represented by between 0 and 3, where 1 is the average flux. The reactions constrained by experimental data are indicated in red, and those predicted by the model are in blue
Fig. 2
Fig. 2
Coefficient of variation for the model’s fluxes. The coefficient of variation (ratio of the standard deviation to the mean) of each flux is represented as a vertical bar. The vertical bars are ordered by metabolic pathways: glycolysis and ethanol synthesis (pink), PPP (dark red), glycerol synthesis (light green), acetaldehyde node (green), reductive branch of the TCA (dark blue), oxidative branch of the TCA (blue) and output fluxes (purple)
Fig. 3
Fig. 3
Correlation matrix. Matrix of correlations between the model’s fluxes. The Pearson correlation values between each pair of fluxes are represented as a gradient of colors from green (−1) to red (+1). The fluxes are ordered by metabolic pathways
Fig. 4
Fig. 4
Relationship between fluxes through the PPP and the biomass flux or the acetate synthesis flux. Relationship between the G6P_6Pgl flux representative of PPP and biomass flux (a). Relationship between the G6P_6Pgl flux representative of PPP and the flux of acetate synthesis (Acald_Ac) (b). Each strain is represented as dots, with the color corresponding to the strain’s origin. The Pearson correlation values are indicated at the bottom of each graph as the significance of the correlation
Fig. 5
Fig. 5
Clustering of flux deviations. Matrix of deviation from the average for 19 fluxes and all strains (a). Each rectangle of the matrix represents a relative deviation index calculated by dividing the deviation between the flux of one reaction for one strain and the average flux for all strains by the average flux of the corresponding reaction. Each line corresponds to all relative deviation indexes for one strain. Each column corresponds to the relative deviation indexes for one reaction and all strains. The lines and column are ordered with respect to the function of their Euclidian distances, which are represented by dendrograms both at the top and the left of the matrix. The distribution of all the relative deviation indexes as well as the corresponding color gradient are in the top left of the matrix. The sub-graphs represent the effect of strain origin on the relative deviation index as well as the distribution of the corresponding flux for eight selected fluxes (red distribution for fluxes constrained by experimental data, and blue for fluxes only predicted by the model) (bi). Simplified schematic representation of the metabolic network (jm). The relative deviation index for four selected strains of different origins is indicated as a percentage. Only the deviations greater than ±8 % are provided
Fig. 6
Fig. 6
Comparison between predicted and measured acetaldehyde production. Graphical comparison of the acetaldehyde production deviation from the average calculated for each origin group between predicted (y-axis) and measured data (x-axis). The vertical and horizontal bars represent the standard errors
Fig. 7
Fig. 7
Principal component analysis of the model’s fluxes. Graphical representation of strain fluxes projected on the two plans defined by the three first axes of the PCA calculated from 14 predicted fluxes for 43 strains. The strains are represented as dots colored by the function of strain origin. On top of each graph is the circle of variables. The red lines correspond to constrained fluxes and the blue lines to predicted fluxes. Plan defined by axis 1 and 2 of the PCA (a). Plan defined by axis 2 and 3 of the PCA (b)

References

    1. Nielsen J. It is all about metabolic fluxes. J Bacteriol. 2003;185:7031–7035. doi: 10.1128/JB.185.24.7031-7035.2003. - DOI - PMC - PubMed
    1. Wiechert W. 13C metabolic flux analysis. Metab Eng. 2001;3:195–206. doi: 10.1006/mben.2001.0187. - DOI - PubMed
    1. Orth JD, Thiele I, Palsson BØ. What is flux balance analysis? Nat Biotechnol. 2010;28:245–248. doi: 10.1038/nbt.1614. - DOI - PMC - PubMed
    1. Schuetz R, Kuepfer L, Sauer U. Systematic evaluation of objective functions for predicting intracellular fluxes in Escherichia coli. Mol Syst Biol. 2007;3:119. doi: 10.1038/msb4100162. - DOI - PMC - PubMed
    1. Burgard AP, Maranas CD. Optimization-based framework for inferring and testing hypothesized metabolic objective functions. Biotechnol Bioeng. 2003;82:670–677. doi: 10.1002/bit.10617. - DOI - PubMed

MeSH terms