

Addressing Child Poverty: How Does the United States Compare With Other Nations?
- PMID: 27044705
- PMCID: PMC6087662
- DOI: 10.1016/j.acap.2016.01.011
Addressing Child Poverty: How Does the United States Compare With Other Nations?
Abstract
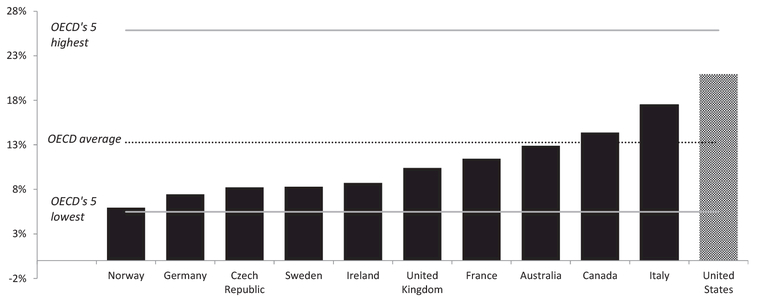
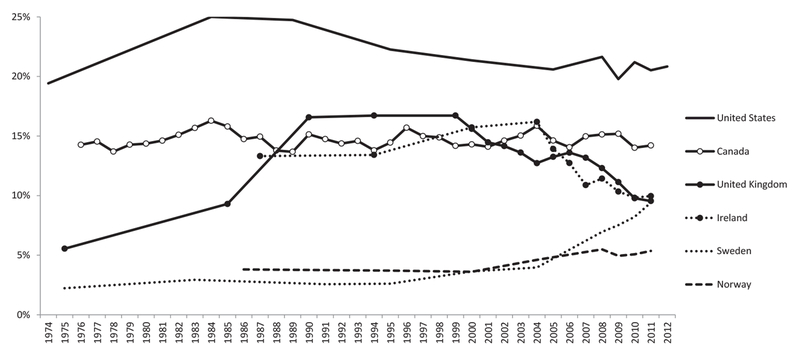
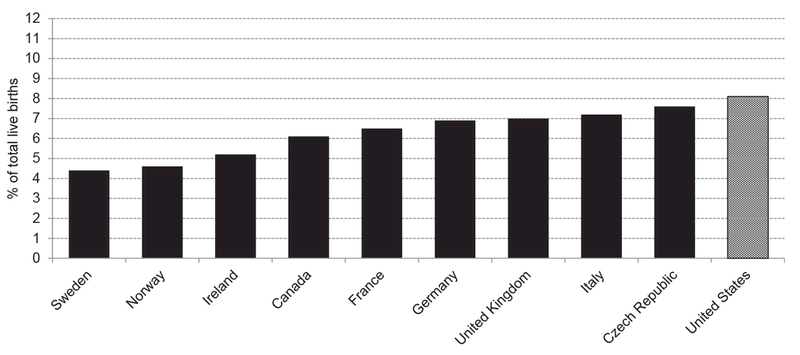
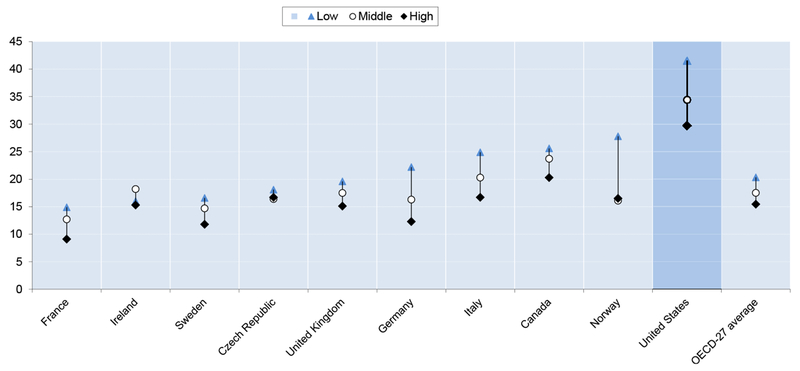
Poverty during childhood raises a number of policy challenges. The earliest years are critical in terms of future cognitive and emotional development and early health outcomes, and have long-lasting consequences on future health. In this article child poverty in the United States is compared with a set of other developed countries. To the surprise of few, results show that child poverty is high in the United States. But why is poverty so much higher in the United States than in other rich nations? Among child poverty drivers, household composition and parent's labor market participation matter a great deal. But these are not insurmountable problems. Many of these disadvantages can be overcome by appropriate public policies. For example, single mothers have a very high probability of poverty in the United States, but this is not the case in other countries where the provision of work support increases mothers' labor earnings and together with strong public cash support effectively reduces child poverty. In this article we focus on the role and design of public expenditure to understand the functioning of the different national systems and highlight ways for improvements to reduce child poverty in the United States. We compare relative child poverty in the United States with poverty in a set of selected countries. The takeaway is that the United States underinvests in its children and their families and in so doing this leads to high child poverty and poor health and educational outcomes. If a nation like the United States wants to decrease poverty and improve health and life chances for poor children, it must support parental employment and incomes, and invest in children's futures as do other similar nations with less child poverty.
Keywords: child poverty; cross-national; income supports; public expenditure; public services.
Copyright © 2016 Academic Pediatric Association. Published by Elsevier Inc. All rights reserved.
Conflict of interest statement
Conflicts of interest: none.
Figures

Similar articles
-
Family pediatrics: report of the Task Force on the Family.Pediatrics. 2003 Jun;111(6 Pt 2):1541-71. Pediatrics. 2003. PMID: 12777595
-
Project Redirection: making and measuring a difference.Adv Adolesc Mental Health. 1990;4:137-57. Adv Adolesc Mental Health. 1990. PMID: 12317627
-
Child Poverty: The United Kingdom Experience.Acad Pediatr. 2016 Apr;16(3 Suppl):S76-82. doi: 10.1016/j.acap.2016.01.012. Acad Pediatr. 2016. PMID: 27044706
-
Child poverty can be reduced.Future Child. 1997 Summer-Fall;7(2):72-87. Future Child. 1997. PMID: 9299838 Review.
-
International policies toward parental leave and child care.Future Child. 2001 Spring-Summer;11(1):98-111. Future Child. 2001. PMID: 11712459 Review.
Cited by
-
Child Poverty and Its Associated Issues in A City, Tokyo: Insights from Community-Based Participatory Research.Children (Basel). 2025 Feb 19;12(2):252. doi: 10.3390/children12020252. Children (Basel). 2025. PMID: 40003354 Free PMC article.
-
Poverty, Material Hardship, and Children's Outcomes: A Nuanced Understanding of Material Hardship in Childhood.Children (Basel). 2022 Jun 30;9(7):981. doi: 10.3390/children9070981. Children (Basel). 2022. PMID: 35883965 Free PMC article.
-
Decomposing multidimensional child poverty and its drivers in the Mouhoun region of Burkina Faso, West Africa.BMC Public Health. 2020 Jan 31;20(1):149. doi: 10.1186/s12889-020-8254-3. BMC Public Health. 2020. PMID: 32005220 Free PMC article.
-
Family Histories and Teen Pregnancy in the United States and Canada.J Marriage Fam. 2018 Oct;80(5):1244-1258. doi: 10.1111/jomf.12512. Epub 2018 Jul 26. J Marriage Fam. 2018. PMID: 30555182 Free PMC article.
-
Unequal From the Start? Poverty Across Immigrant Generations of Hispanic Children.Demography. 2021 Dec 1;58(6):2139-2167. doi: 10.1215/00703370-9519043. Demography. 2021. PMID: 34596221 Free PMC article.
References
-
- Smeeding T. Gates, Gaps, and Inter-Generational Mobility (IGM): The Importance of an Even Start. Princeton, NJ: Education Testing Services; in press.
-
- Cooper K, Stewart K. Does money affect children’s outcomes? A systematic review of the evidence. London: Department of Social Policy, London School of Economics; 2015.
-
- OECD. In It Together – Why Less Inequality Benefits All. Paris: OECD Publishing; 2015.
-
- Walker R. Ending Child Poverty – Popular Welfare for the 21st Century? United Kingdom: Bristol Policy Press; 1999.
-
- Blair T. Our Nation’s Future – Social Exclusion. Available at: http://www.britishpoliticalspeech.org/speech-archive.htm?speech=283 Accessed July 10, 2015.
MeSH terms
Grants and funding
LinkOut - more resources
Full Text Sources
Other Literature Sources
