. 2016 Jun 3;291(23):12310-21.
doi: 10.1074/jbc.M115.707224. Epub 2016 Apr 4.

Molecular Mechanism of Regulation of MTA1 Expression by Granulocyte Colony-stimulating Factor

Affiliations

Molecular Mechanism of Regulation of MTA1 Expression by Granulocyte Colony-stimulating Factor

Arathy S Kumar et al. J Biol Chem. .

Abstract

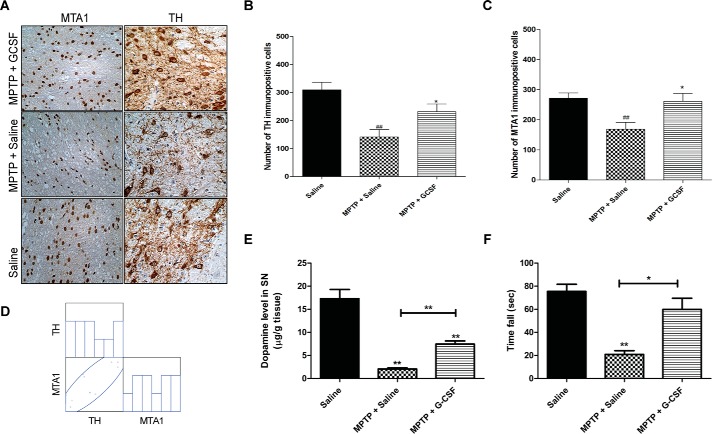
Parkinson disease (PD) is a neurodegenerative disorder with loss of dopaminergic neurons of the brain, which results in insufficient synthesis and action of dopamine. Metastasis-associated protein 1 (MTA1) is an upstream modulator of tyrosine hydroxylase (TH), the rate-limiting enzyme in dopamine synthesis, and hence MTA1 plays a significant role in PD pathogenesis. To impart functional and clinical significance to MTA1, we analyzed MTA1 and TH levels in the substantia nigra region of a large cohort of human brain tissue samples by Western blotting, quantitative PCR, and immunohistochemistry. Our results showed that MTA1 and TH levels were significantly down-regulated in PD samples as compared with normal brain tissue. Correspondingly, immunohistochemistry analysis for MTA1 in substantia nigra sections revealed that 74.1% of the samples had a staining intensity of <6 in the PD samples as compared with controls, 25.9%, with an odds ratio of 8.54. Because of the clinical importance of MTA1 established in PD, we looked at agents to modulate MTA1 expression in neuronal cells, and granulocyte colony-stimulating factor (G-CSF) was chosen, due to its clinically proven neurogenic effects. Treatment of the human neuronal cell line KELLY and acute 1-methyl-4-phenyl-1,2,3,6-tetrahydropyridine mouse model with G-CSF showed significant induction of MTA1 and TH with rescue of phenotype in the mouse model. Interestingly, the observed induction of TH was compromised on silencing of MTA1. The underlying molecular mechanism of MTA1 induction by G-CSF was proved to be through induction of c-Fos and its recruitment to the MTA1 promoter.

Keywords: Parkinson disease; dopamine; growth factor; nuclear receptor; transcription coregulator.


Figures

FIGURE 1.
FIGURE 1.
MTA1 and TH are down-regulated in SN of Parkinson disease brain tissue samples. A, real time PCR analysis for MTA1 and TH expression performed on brain SN tissue of normal subjects (n = 4) and PD patients (n = 26). GAPDH was used as housekeeping control. Non-parametric Mann-Whitney U test showed that the difference between the normal and PD groups for MTA1 and TH levels was statistically significant at p = 0.014 and 0.011, respectively. y axis, relative gene expression. B, lysates from brain SN tissue of normal subjects (n = 4) and PD patients (n = 29) were analyzed for MTA1 and TH expression by Western blotting. Nuclear lysates and rat adrenal lysates were used as positive control (PC) for MTA1 and TH, respectively. GAPDH was used as internal loading control.
FIGURE 2.
FIGURE 2.
MTA1 and TH expression shown direct correlation in brain tissue. A, representative immuno-stained paraffin-embedded brain SN sections (for MTA1 and TH) in normal and PD tissues. B, expressions of immunopositivity in sections were quantified at a magnification of ×100 under light microscopy. Five random microscopic fields per section were counted for each protein. Cells in the SN were counted with image analysis software (Optika View 2, Italy). Data were expressed as mean. Statistical analysis was performed by unpaired Student's t test using SPSS version 16.0 software. Box plot represents the number of immunopositive cells (MTA1/TH) in normal (n = 22) and PD samples (n = 25). y axis, number of immunopositive cells.
FIGURE 3.
FIGURE 3.
G-CSF treatment in vitro and in vivo leads to corresponding up-regulation of MTA1 and TH expression. A, neuroblastoma cell line KELLY was treated with G-CSF (100 ng/ml) for indicated time points, and expressions of MTA1, TH, and cyclin D3 were analyzed. Vinculin was used as internal loading control and cyclin D3 as positive control for G-CSF treatment. B, real time PCR analysis of MTA1 and TH expression in G-CSF-treated KELLY cells. Graph represents mean ± S.E. *, p < 0.05 compared with untreated cells. C, treatment of mice with pegylated G-CSF (120 μg/kg) for the indicated time point (for 4 h) and analyzed for expression of MTA1, TH, and cyclin D3. Expression data represent three mice per group. D, expression of MTA1 and TH after siRNA-mediated down-regulation of MTA1, followed by G-CSF treatment in KELLY cells.
FIGURE 4.
FIGURE 4.
Beneficial effect of G-CSF treatment on MPTP-induced parkinsonism and its correlation with MTA1 and TH. A, effect of G-CSF on beam walk test in MPTP-intoxicated mice represents the time taken to cross the path (seconds), immobility period (seconds), and number of foot slips, respectively. Values were expressed in means ± S.E., n = 10, 9, and 8 animals in groups I–III, respectively. Statistical analysis was performed using unpaired Student's t test. # indicates p < 0.05 versus group I; * indicates p < 0.05 versus group II. Correlation analysis was performed using Pearson's correlation test; graph shows the correlation between TH and MTA1 with time taken to cross the path, immobility period, and number of foot slips. B, effect of G-CSF on stride length in MPTP-intoxicated mice represents the time taken to cross the runway (seconds), average distance between each forelimb (centimeters), and average distance between each hind limb (centimeters), respectively. Values were expressed in means ± S.E., n = 10, 9, and 8 animals in group, I–III, respectively. Statistical analysis was performed using unpaired Student's t test. # and ## indicates p < 0.05 and 0.01, respectively, versus group I; * indicates p < 0.05 versus group II. Correlation analysis was performed using Pearson's correlation test; graph shows the correlation between TH and MTA1 with time taken to cross the runway, and average distance between each fore and hind limb.
FIGURE 5.
FIGURE 5.
Expression pattern of MTA1 and TH in MPTP-induced Parkinsonism before and after G-CSF treatment. A, representative immunohistological images of TH and MTA1 expression in saline, MPTP, and MPTP + G-CSF-treated mouse brains under ×400 magnification. B and C, graphs show TH- and MTA1-immunopositive cells, respectively; values were expressed as means ± S.E., n = 10, 9, and 8 animals in group I (saline), II (MPTP), and III (MPTP + G-CSF), respectively; statistical analysis was performed using unpaired Student's t test. ## indicates p < 0.01 versus group I; * indicates p < 0.05 versus group II. D, correlation analysis was performed using Pearson's correlation test; graph shows the correlation between TH and MTA1. E, graph shows dopamine levels (micrograms/g tissue) in saline-, MPTP-, and MPTP + G-CSF-treated mouse brains. Values were expressed in means ± S.E., n = 3 animals in each group respectively. Statistical analysis was performed using unpaired Student's t test. ** indicates p < 0.005 compared with saline or MPTP. F, effect of G-CSF on rotarod performance in MPTP-intoxicated mice. Values represent the time taken to fall (seconds). Values were expressed in means ± S.E., n = 3 animals in each group. Statistical analysis was performed using unpaired Student's t test. ** indicates p < 0.005 versus saline; * indicates p < 0.05 versus MPTP.
FIGURE 6.
FIGURE 6.
MTA1 up-regulation by G-CSF is mediated through c-Fos. A, KELLY cells were transfected with 0.5 μg of 3-kb pGL3 MTA1 full-length (FL)- luciferase reporter or pGL3 basic vector plasmid. After 24 h, the cells were treated with G-CSF for 2 h; the cells were lysed, and luciferase activity was measured (n = 3) and normalized with β-galactosidase activity. Each value represents the mean ± S.E. **, p < 0.005, and ***, p < 0.001, compared with vector by Tukey test after one-way ANOVA. B, KELLY cells were co-transfected with 0.5 μg of 3-kb pGL3 MTA1 full-length (FL)-luciferase reporter and 0.5 μg of pcDNA3.1 c-Fos (pc-Fos) or pGL3 basic vector plasmid. After 24 h, the cells were lysed, and luciferase activity was measured (n = 3) and normalized with β-galactosidase activity. Each value represents the means ± S.E. *, p < 0.05, and **, p < 0.005 compared with basic vector by Tukey test after one-way ANOVA. C, schematic representation of the 3-kb MTA1 promoter, showing the regions analyzed. ChIP analysis shows the recruitment of c-Fos to human MTA1 promoter in KELLY cells. The ChIP was carried out with an anti-c-Fos antibody followed by PCR amplification using the specific primers. Input represents around 1–10% of the total immunoprecipitated DNA. D, EMSA analysis of c-Fos binding to the human MTA1 promoter using the wild type biotin-labeled probe encompassing c-Fos-binding site using Kelly cell nuclear lysate. * indicates the specific band of interest.
FIGURE 7.
FIGURE 7.
G-CSF-mediated induction of MTA1 is compromised on deleting c-Fos binding region/or on silencing c-Fos. A, KELLY cells were transfected with 0.5 μg of 3-kb pGL3 MTA1 full-length (FL)-luciferase reporter or pGL3 MTA1 c-Fos binding region deleted (DEL)-luciferase reporter or pGL3 basic vector plasmid. After 24 h, the cells were treated with G-CSF for 2 h and then cells were lysed, and luciferase activity was measured (n = 3) and normalized with β-galactosidase activity. Each value represents the means ± S.E. *, p < 0.05, **, p < 0.005, and ***, p < 0.001 compared with vector by Tukey test after one-way ANOVA. B, KELLY cells were co-transfected with 0.5 μg of 3-kb pGL3 MTA1 full-length (FL)-luciferase reporter or pGL3 MTA1 c-Fos binding region deleted (DEL)-luciferase reporter or pGL3 basic vector plasmid and 0.5 μg of pcDNA 3.1 c-Fos (pc-Fos). After 24 h, the cells were lysed, and luciferase activity was measured (n = 3) and normalized with β-galactosidase activity. Each value represents the mean ± S.E. **, p < 0.005, and ***, p < 0.001 compared with basic vector by Tukey test after one-way ANOVA. C, KELLY cells were transfected with 0.5 μg of 3-kb pGL3 MTA1 full-length (FL)-luciferase reporter or pGL3 basic vector plasmid after silencing the cells with c-Fos siRNA. After 24 h, the cells were treated with G-CSF for 2 h, and the cells were lysed, and luciferase activity was measured (n = 3) and normalized with β-galactosidase activity. Each value represents the mean ± S.E. *, p < 0.05, **, p < 0.005, and ***, p < 0.001 compared with vector by Tukey test after one-way ANOVA. D, expression of c-Fos, TH, and MTA1 after siRNA-mediated down-regulation of c-Fos, followed by G-CSF treatment in KELLY cells. E, schematic representation of TH regulation through MTA1 via G-CSF-mediated STAT3/MAPK pathway induction of c-Fos, followed by binding of c-Fos to the MTA1 promoter.

Similar articles

Cited by

References

    1. Mullin S., and Schapira A. (2015) The genetics of Parkinson's disease. Br. Med. Bull. 114, 39–52 - PubMed
    1. Trinh J., and Farrer M. (2013) Advances in the genetics of Parkinson disease. Nat. Rev. Neurol. 9, 445–454 - PubMed
    1. Zhu Y., Zhang J., and Zeng Y. (2012) Overview of tyrosine hydroxylase in Parkinson's disease. CNS Neurol. Disord. Drug Targets 11, 350–358 - PubMed
    1. Huynh T. (2011) The Parkinson's disease market. Nat. Rev. Drug Discov. 10, 571–572 - PubMed
    1. Meuer K., Pitzer C., Teismann P., Krüger C., Göricke B., Laage R., Lingor P., Peters K., Schlachetzki J. C., Kobayashi K., Dietz G. P., Weber D., Ferger B., Schäbitz W. R., Bach A., et al. (2006) Granulocyte-colony stimulating factor is neuroprotective in a model of Parkinson's disease. J. Neurochem. 97, 675–686 - PubMed

Publication types

MeSH terms