. 2016 May 16;36(11):1639-54.
doi: 10.1128/MCB.00020-16. Print 2016 Jun 1.

Structural Analysis of the Myo1c and Neph1 Complex Provides Insight into the Intracellular Movement of Neph1

Affiliations

Structural Analysis of the Myo1c and Neph1 Complex Provides Insight into the Intracellular Movement of Neph1

Ehtesham Arif et al. Mol Cell Biol. .

Abstract

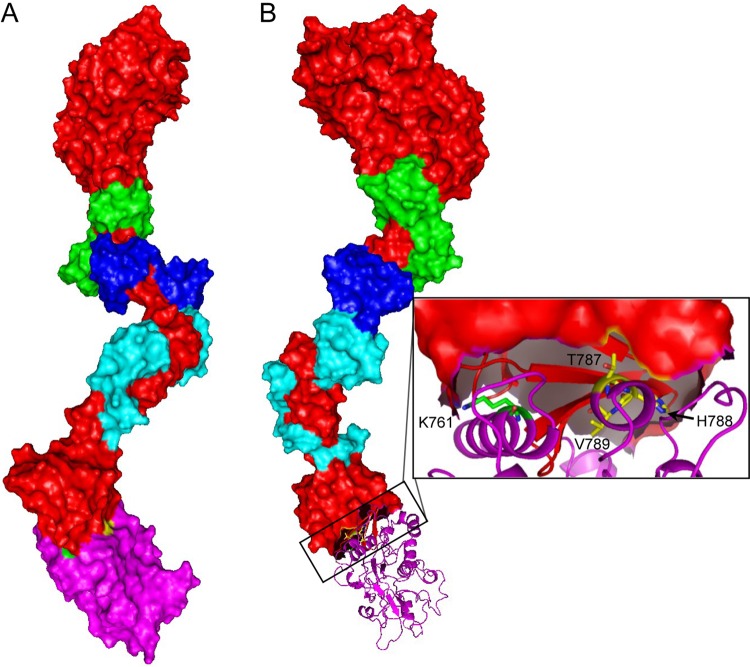
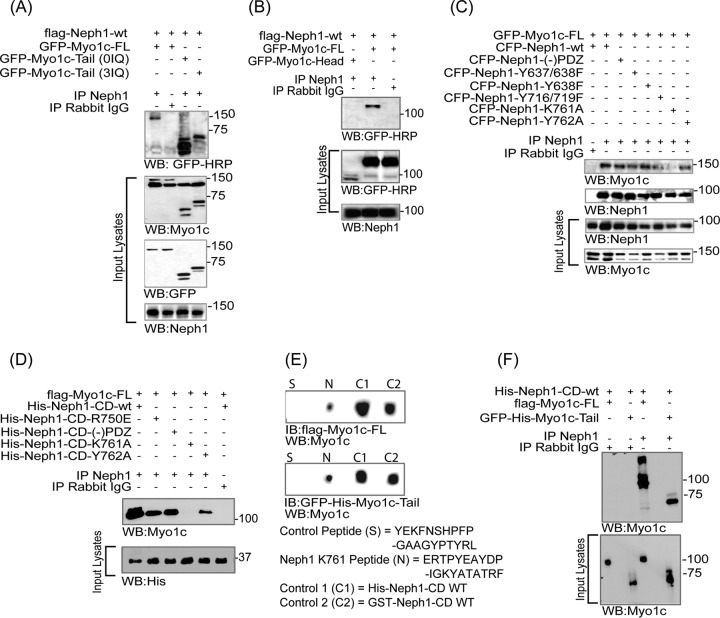
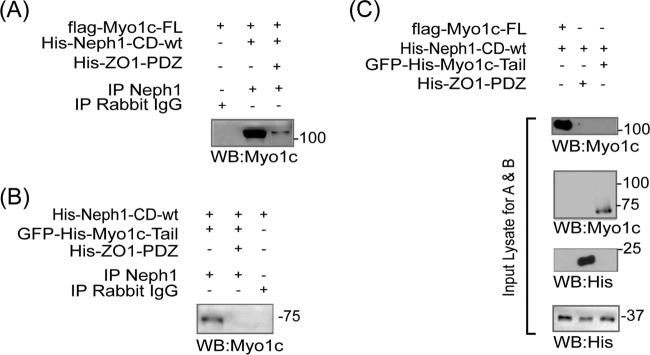
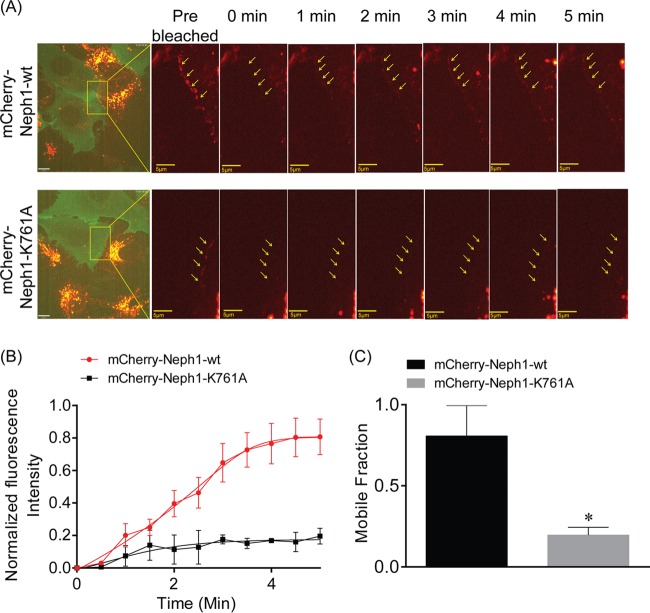
The Myo1c motor functions as a cargo transporter supporting various cellular events, including vesicular trafficking, cell migration, and stereociliary movements of hair cells. Although its partial crystal structures were recently described, the structural details of its interaction with cargo proteins remain unknown. This study presents the first structural demonstration of a cargo protein, Neph1, attached to Myo1c, providing novel insights into the role of Myo1c in intracellular movements of this critical slit diaphragm protein. Using small angle X-ray scattering studies, models of predominant solution conformation of unliganded full-length Myo1c and Myo1c bound to Neph1 were constructed. The resulting structures show an extended S-shaped Myo1c with Neph1 attached to its C-terminal tail. Importantly, binding of Neph1 did not induce a significant shape change in Myo1c, indicating this as a spontaneous process or event. Analysis of interaction surfaces led to the identification of a critical residue in Neph1 involved in binding to Myo1c. Indeed, a point mutant from this site abolished interaction between Neph1 and Myo1c when tested in the in vitro and in live-cell binding assays. Live-cell imaging, including fluorescence recovery after photobleaching, provided further support for the role of Myo1c in intracellular vesicular movement of Neph1 and its turnover at the membrane.


Figures

FIG 1
FIG 1
SPR analysis. Sensorgrams for various concentrations of His-Neph1-CD binding to immobilized Flag-Myo1c-FL are shown. Results are expressed as a differential response (in response units [RU]) versus time. Flag-Myo1c-FL was immobilized on a CM5 chip at 826 RU, and His-Neph1-CD protein at concentrations of 1.0, 0.5, and 0.25 μM was passed over the chip for 3 min and allowed to dissociate for about 4 min. Analysis of the difference between binding sensorgrams of the test and control (without protein) was performed using Biacore BIAevaluation software using a 1:1 Langmuir model. The calculated affinity constant (KD) for Myo1c-Neph1 interaction was 1.1 × 10⁻⁸ M (11 nM).
FIG 2
FIG 2
SAXS data of unliganded protein samples. (A) (Left) SAXS intensity profiles acquired from the solutions of Myo1c-FL and its head and tail domains are presented. The inset shows linear fit to the Guinier region of the measured data sets. (Right) The P(r) curves computed for Myo1c-FL and its head and tail domains demonstrate the frequency distribution of interatomic vectors in the predominant scattering species. The inset shows the Kratky plots of the data sets. (B) Scattering shape of the proteins restored from dummy atom modeling using the SAXS data as a reference. The envelope shape (represented as mesh) of the predominant shape computed for full-length Myo1c and its head and tail domains is shown. Crystal structures of the head, tail, and full-length Myo1c (reconstructed by joining head and tail regions) with bound calmodulins (represented as surface) were overlaid by automated alignment of inertial axes with SAXS models. The structure of Myo1c is represented in red, while three calmodulins are represented in green, blue, and cyan.
FIG 3
FIG 3
SAXS data of the Myo1c-Neph1 complex. (A) SAXS intensity profiles from unliganded Myo1c (diluted to same molar concentration) and an ∼1:1 molar mixture of Myo1c with different Neph1-CD. The Guinier analysis of the data sets presuming globular scattering shape is shown in the inset. (B) P(r) computed from the indirect Fourier transformation of the data sets.
FIG 4
FIG 4
SAXS data-based shape of the Myo1c-Neph1 complex. (A) Scattering shape of Myo1c-Neph1 complex restored from dummy atom modeling using the SAXS data (I); manual alignment of full-length Myo1c (salmon) on the complex shows an additional volume at the tail region (II and III). (B) The six lowest-energy docking poses of Myo1c-Neph1 complex (I and II); alignment of docking models on SAXS models clearly ruled out two possible docking models (X), and the remaining four could be the more probable structural models of the Myo1c-Neph1 complex (III). The lowest-energy model (√) was used for further interaction analysis (IV).
FIG 5
FIG 5
Structural model of the Myo1c/Neph1-CD complex. (A) Myo1c and Neph1-CD proteins are depicted in red and magenta surface representation. The three calmodulins bound to the IQ domain of Myo1c are shown in green, blue, and cyan surface representation mode. The residues K761 and THV (PDZ-binding residues) in Neph1-CD are present in interaction interface. (B) The binding site for ZO1-PDZ1 (yellow) in Neph1-CD (magenta ribbon) is occluded when Neph1-CD interacts with Myo1c.
FIG 6
FIG 6
Neph1 interacts with the IQ domains and C-terminal region of Myo1c. (A and B) COS7 cells were cotransfected with Flag-Neph1-wt and various Myo1c constructs, including GFP-Myo1c-FL, GFP-Myo1c-tail (with no IQ domain), GFP-Myo1c (3IQ domain), and GFP-Myo1c (head), and immunoprecipitated (IP) with Neph1 antibody. Immune complexes were evaluated for binding with Myo1c by Western blotting (WB) with GFP-HRP. Neph1 interacted with GFP-Myo1c-FL and GFP-Myo1c tail with or without the IQ domains but not with the GFP-Myo1c head. (C) In a reciprocal experiment, Neph1 mutants, including the phosphorylation site mutants (CFP-Neph1-Y637/638 and -Y716/719) and the deletion mutant CFP-Neph1-(−)PDZ (without the PDZ binding domain) and the CFP-Neph1-K761 mutant, were cotransfected with GFP-Myo1c-FL in COS7 cells and tested for binding to Myo1c. All the Neph1 mutants interacted with Myo1c except CFP-Neph1-Y761A. (D) The recombinant His-tagged Neph1 (His-Neph1 CD-wt) and its mutants, including His-Neph1-CD-R750E, His-Neph1-CD-(−)PDZ, His-Neph1-CD-K761A, and His-Neph1-CD-Y762A, were separately mixed with the purified Flag-Myo1c-FL protein produced in baculovirus, and pulldown was performed using Neph1 antibody. Western blot analysis using Myo1c antibody showed loss of interaction with Myo1c in the His-Neph1-CD-K761A mutant. (E) A peptide binding experiment showed that similar to purified His-Neph1-CD-wt and GST-Neph1-CD-wt, the peptide containing the K761 region had strong affinity toward Flag-Myo1c-FL and GFP-Myo1c-tail. IB, immunoblotting. (F) Recombinant proteins His-Neph1-CD-wt and either Flag-Myo1c-FL or GFP-His-Myo1c-tail were mixed and pulled down with Neph1 antibody. Western blotting using myo1c antibody was performed to evaluate binding of Neph1 with the Myo1c tail region.
FIG 7
FIG 7
Myo1c competes with ZO1 for binding with Neph1. (A and B) Competitive-binding experiment in which recombinant Flag-Myo1c-FL was mixed with His-Neph1-CD-wt protein in the presence or absence of purified His-ZO1-PDZ1 protein and Neph1 was immunoprecipitated using Neph1 antibody. Immunoprecipitation analysis of the Neph1 complex suggests that binding between Neph1 and Myo1c was significantly reduced in the presence of ZO1. Similar results were obtained when GFP-His-Myo1c-tail was substituted in this assay (B). (C) Purified protein samples used for binding experiments in panels A and B.
FIG 8
FIG 8
The turnover rate of Neph1 at the podocyte cell membrane is decreased upon loss of Myo1c binding. (A) The turnover rate of Neph1 at the podocyte cell membrane was analyzed in cultured podocytes stably transfected with mCherry-Neph1-wt and mCherry-Neph1-K761A by fluorescence recovery after photobleaching (FRAP). A region of interest (ROI) at the cell junction was selected and photobleached. The recovery of Neph1 at the photobleached region was recorded over a period of 5 min. Arrows indicate the localization of mCherry-Neph1-wt at the cell-cell junctions. (B) The FRAP analysis suggests a high turnover rate for Neph1-wt with >50% fluorescence recovery (n = 3 experiments) at the membrane within 3 min of recovery time, whereas the Myo1c-binding Neph1-K761A mutant displayed <10% (n = 3 experiments) recovery under similar conditions. (C) The observed mobile fraction for mCherry-Neph1-wt was about 80%, compared to 20% for the Neph1-K761A mutant. Data are presented as means ± SEM.
FIG 9
FIG 9
Neph1 intracellular distribution changes with cellular confluency. Untransfected podocytes and mCherry-Neph1-wt-expressing podocytes were cultured at very low confluence (<20%) to full confluence levels (100%) and analyzed by immunofluorescence microscopy for endogenous Neph1 and mCherry Neph1 localization at different stages of confluence. The localization of mCherry Neph1 (top) changed in a fashion similar to endogenous Neph1 (bottom) from mostly intracellular at low confluence to cell-cell junctions at high confluence. Arrowheads indicate the localization of mCherry-Neph1-wt at the cell-cell junctions. Scale bars represent 10 μm.
FIG 10
FIG 10
Loss of Myo1c binding does not influence distribution of Neph1 into various subcellular compartments. To confirm the identity of Neph1-containing vesicles, podocytes stably expressing either mCherry-Neph1-wt or mCherry-Neph1-K761A were colabeled with markers of the early endosome, late endosome, Golgi complex, and lysosome using cell light reagents. Live-cell imaging was performed using confocal microscopy, and deconvoluted images were constructed and are presented (A). Single-plane images were used for analyzing colocalization of Neph1-wt and Neph1-K761A with the early endosome, late endosome, Golgi complex, and lysosome using ImageJ software. (B) Pearson's correlation coefficients are presented as means ± SEM. Scale bars represent 10 μm.
FIG 11
FIG 11
Neph1 vesicular movement requires its interaction with Myo1c. (A and B) mCherry-Neph1-wt and the K761A mutant were plated on a glass-bottom cell culture plate, and the movement of Neph1-containing vesicles was analyzed using time-lapse live imaging. The vesicular movement was plotted as displacement (micrometers, y axis) versus time (seconds, x axis). (C and D) The displacement (micrometers) and velocity (micrometers per second) of mCherry-Neph1-K761A vesicles were significantly decreased compared to those of mCherry-Neph1-wt (P < 0.001). Data are presented as means ± SEM.

References

    1. Tryggvason K, Patrakka J, Wartiovaara J. 2006. Hereditary proteinuria syndromes and mechanisms of proteinuria. N Engl J Med 354:1387–1401. doi:10.1056/NEJMra052131. - DOI - PubMed
    1. Tryggvason K, Pikkarainen T, Patrakka J. 2006. Nck links nephrin to actin in kidney podocytes. Cell 125:221–224. doi:10.1016/j.cell.2006.04.002. - DOI - PubMed
    1. Welsh GI, Saleem MA. 2012. The podocyte cytoskeleton—key to a functioning glomerulus in health and disease. Nat Rev Nephrol 8:14–21. - PubMed
    1. Faul C, Asanuma K, Yanagida-Asanuma E, Kim K, Mundel P. 2007. Actin up: regulation of podocyte structure and function by components of the actin cytoskeleton. Trends Cell Biol 17:428–437. doi:10.1016/j.tcb.2007.06.006. - DOI - PubMed
    1. Buccione R, Orth JD, McNiven MA. 2004. Foot and mouth: podosomes, invadopodia and circular dorsal ruffles. Nat Rev Mol Cell Biol 5:647–657. doi:10.1038/nrm1436. - DOI - PubMed

LinkOut - more resources