. 2016 Apr 11;213(1):97-108.
doi: 10.1083/jcb.201501006. Epub 2016 Apr 4.

Kindlin-2 directly binds actin and regulates integrin outside-in signaling

Affiliations

Kindlin-2 directly binds actin and regulates integrin outside-in signaling

Kamila Bledzka et al. J Cell Biol. .

Abstract

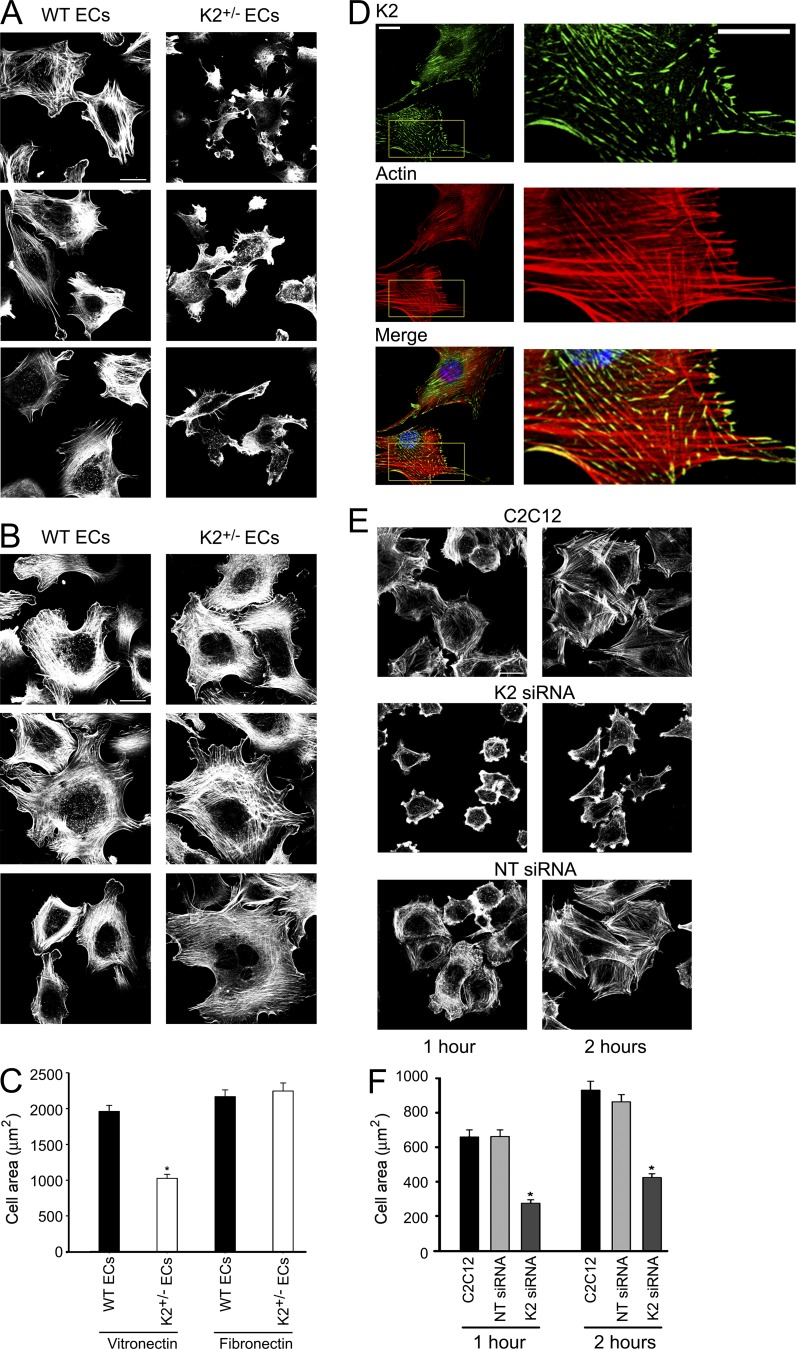
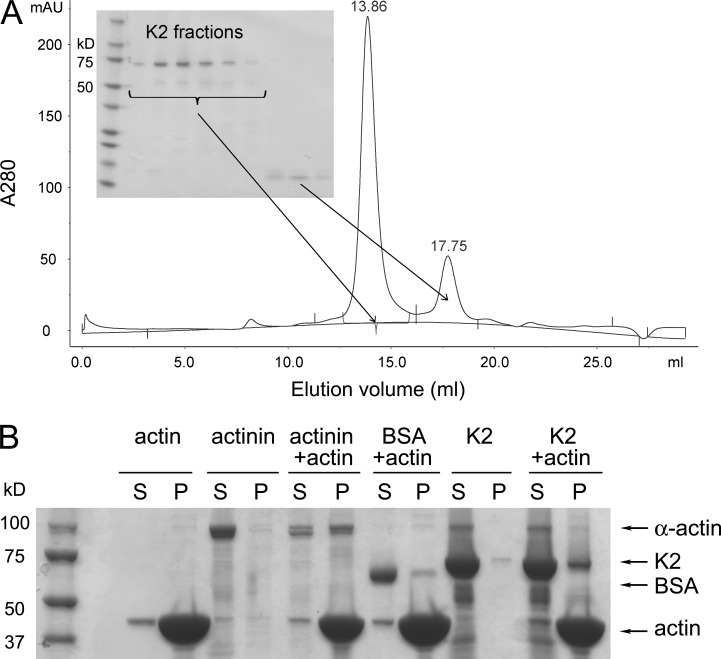
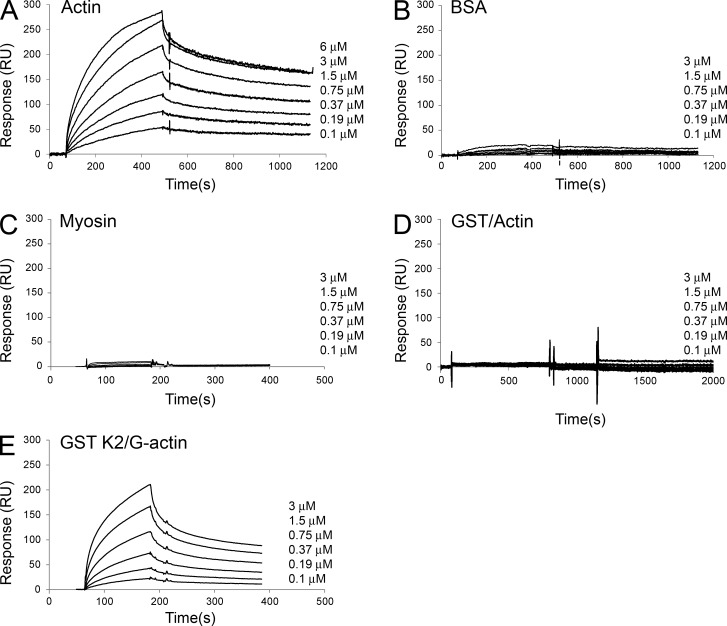
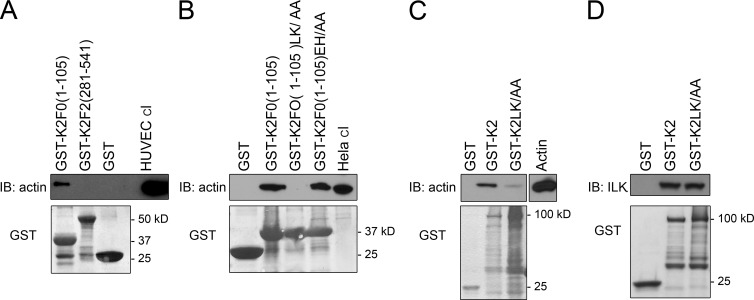
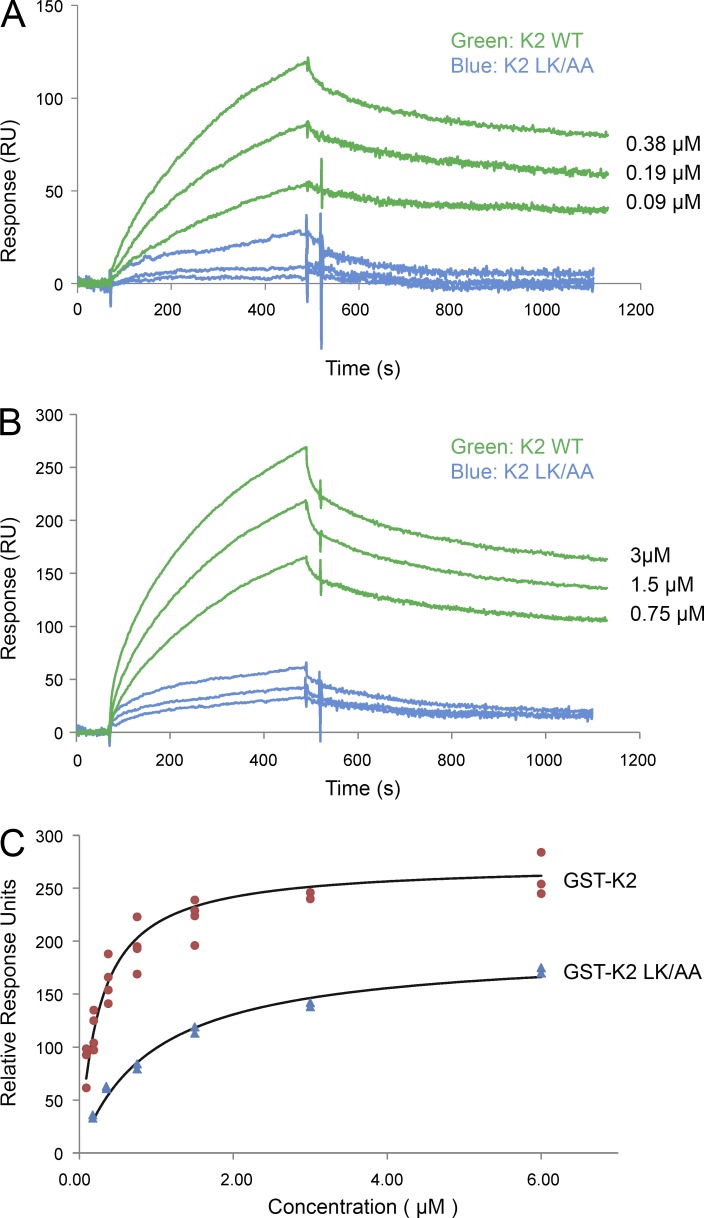
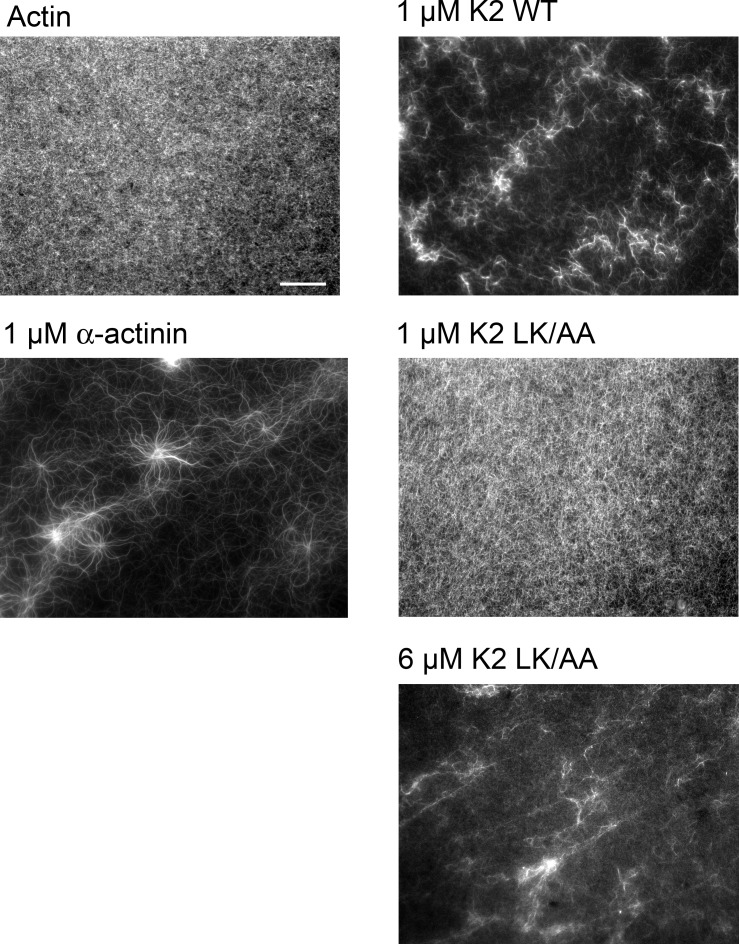
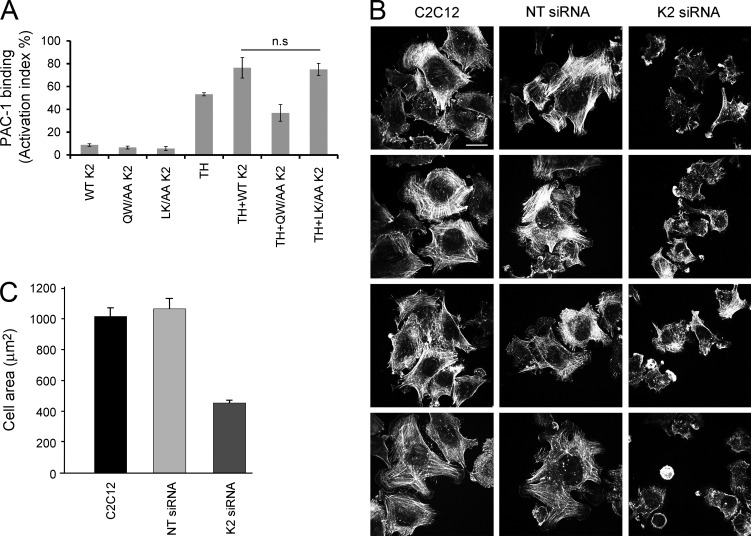
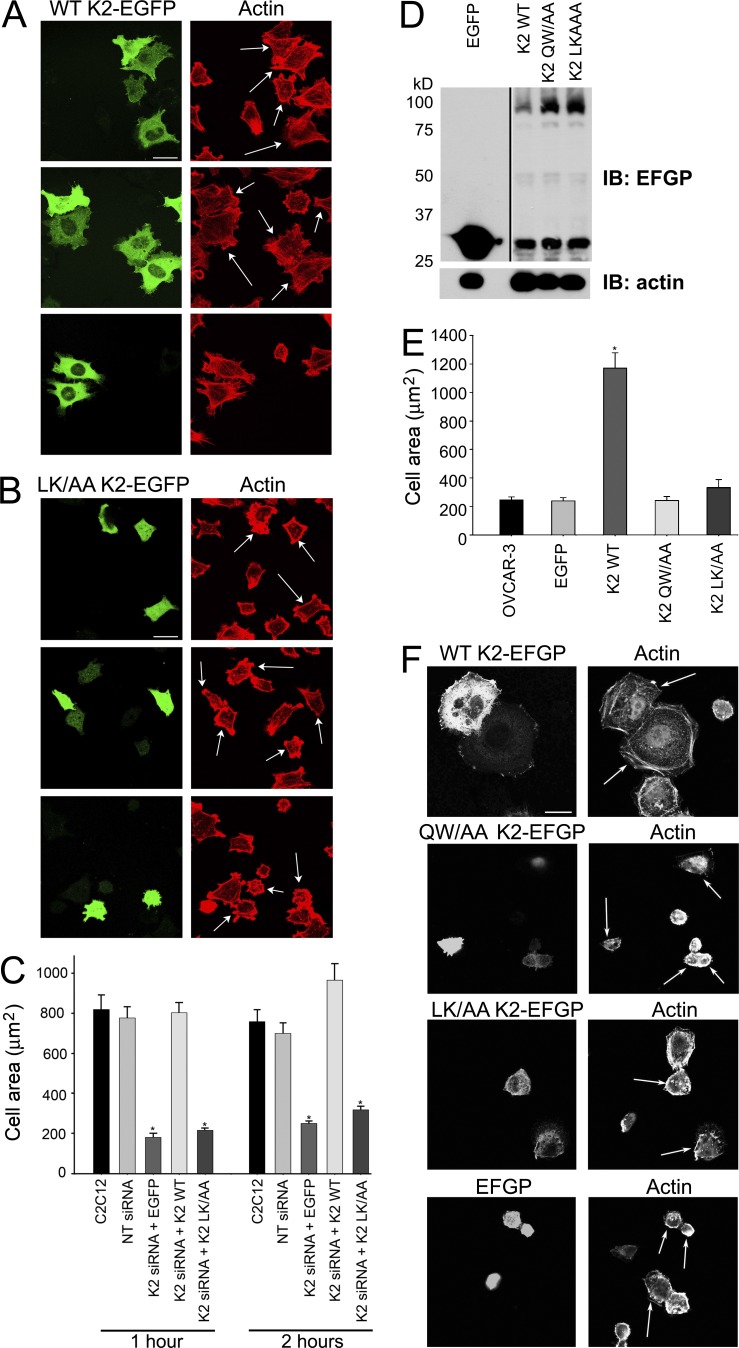
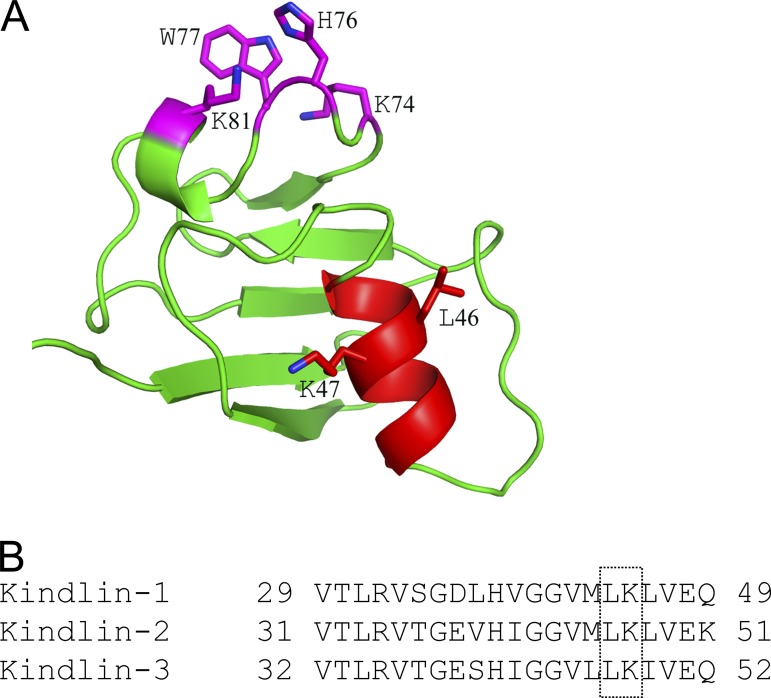
Reduced levels of kindlin-2 (K2) in endothelial cells derived from K2(+/-)mice or C2C12 myoblastoid cells treated with K2 siRNA showed disorganization of their actin cytoskeleton and decreased spreading. These marked changes led us to examine direct binding between K2 and actin. Purified K2 interacts with F-actin in cosedimentation and surface plasmon resonance analyses and induces actin aggregation. We further find that the F0 domain of K2 binds actin. A mutation, LK(47)/AA, within a predicted actin binding site (ABS) of F0 diminishes its interaction with actin by approximately fivefold. Wild-type K2 and K2 bearing the LK(47)/AA mutation were equivalent in their ability to coactivate integrin αIIbβ3 in a CHO cell system when coexpressed with talin. However, K2-LK(47)/AA exhibited a diminished ability to support cell spreading and actin organization compared with wild-type K2. The presence of an ABS in F0 of K2 that influences outside-in signaling across integrins establishes a new foundation for considering how kindlins might regulate cellular responses.


Figures

Figure 1.
Figure 1.
Actin disorganization in cells expressing reduced K2. (A and B) Visualization of actin in MAE cells (ECs) from WT and K2+/− mice. MAE cells were spread on vitronectin (A) or fibronectin (B) for 2 h, fixed, and stained with Alexa Fluor 488–phalloidin. Bar, 20 µm. (C) Areas of cells were measured using ImageJ software, and 80 cells were quantified in each sample. The error bars represent means ± standard error of two independent experiments (*, P < 0.001 vs. WT endothelial cells [control] by Student’s t test.). (D) Visualization of actin and K2 in C2C12 mouse myoblastoid cells. K2 (green) colocalized with actin (red) in filaments and FA. The merged image of K2 (green) with actin (red) is shown in the bottom panel. The C2C12 cells were spread on fibronectin for 1 h, fixed, permeabilized, and stained with anti-K2 followed by Alexa Fluor 488 anti-mouse IgG and Alexa Fluor 568–phalloidin. Bar, 10 µm. Higher-magnification images to visualize actin stress fibers are shown next to each panel. Bar, 5 µm. (E) Visualization of actin in C2C12 cells after K2 knock-down with siRNA. C2C12 cells were spread on fibronectin for 1 or 2 h, fixed, and stained with Alexa Fluor 488–phalloidin. F-actin is in a linear pattern in untreated cells (top) and cells treated with NT-siRNA (bottom) but redistributes to the membrane in cells treated with K2 siRNA (middle). Bar, 20 µm. (F) Areas of cells were measured using ImageJ software, and 100 cells were quantified in each sample. Means ± standard error of two independent experiments are shown (*, P < 0.001 vs. C2C12 control by Student’s t test).
Figure 2.
Figure 2.
K2 purification and direct binding to actin. (A) Superdex 200 10/300 GF column elution profile of K2 (75 kD). K2 after GST-Sepharose purification and GST cleavage with Factor Xa was subjected to gel filtration on a Superdex 200 10/300 GL. Protein was eluted with 20 mM Tris, 100 mM NaCl, and 1 mM DTT, pH 8.0, at a flow rate of 0.5 ml/min. The void volume was ∼8 ml, the bed volume was 24 ml, and the elution volume for BSA (66 kD) under the same conditions was ∼14 ml. SDS-PAGE of peak fractions is shown as an inset. mAU, milli–arbitrary unit. (B) Association of K2 with actin by cosedimentation. K2, BSA, or α-actinin, each at 10 µM, was added to F-actin and incubated for 30 min, and supernatant (S) and pellet fractions (P) were separated by centrifugation and analyzed by SDS-PAGE (4–20% gel).
Figure 3.
Figure 3.
Binding of K2 to actin by SPR. (A) Actin was immobilized on CM5 biosensor chips. Various concentrations of full-length K2 (GST constructs) was injected over the coated chips, and the progress curves of binding were recorded. (B and C) The experimental conditions are the same as in A except that the CM5 biosensor chips were coated with BSA (B) or myosin (C). (D) Chips were coated with actin as in A, but the soluble analyte was GST alone. (E) Conditions are the same as in A except that the biosensor chip was coated with an actin mutant (Joel et al., 2004) that cannot polymerize, a mimetic of G-actin. The coating densities of all proteins on the chips were similar based on response unit (RU) values of ∼1,000. The progress curves shown have had mock runs (buffer only) and the empty flow cell controls subtracted. Tracings of K2 binding to actin are representative of at least eight experiments.
Figure 4.
Figure 4.
LK47 residues in the F0 domain of K2 are essential for actin binding. (A) GST-fused K2, a GST-K2F0 fragment, a GST-K2F2 fragment, and GST alone were added to the lysates of HUVECs followed by 20 µl glutathione-Sepharose 4B. The bound actin was measured by immunoblotting (IB) with an anti-actin antibody. (B) GST-fused K2, a GST-K2F0(1–105) fragment, GST-K2F0(1–105)LK47/AA mutant, GST-K2F0(1–105)E38H40/AA, and GST alone were used in pull-down assays to precipitate actin from HeLa cell lysates as in A. (C) GST-fused K2, GST-K2LK47/AA mutant, and GST alone were used in pull-down assays to precipitate actin purified from rabbit skeletal muscle. (D) GST-fused K2, GST-K2LK47/AA mutant, and GST alone were used in pull-down assays to precipitate ILK from HeLa cell lysates as in A. Below each panel is the loading control. The gels below A, B, and C are stained with Amido black and that below D with Coomassie blue.
Figure 5.
Figure 5.
Effect of the LK47/AA mutation in K2 on direct actin binding by SPR. (A and B) SPR tracings comparing the binding of WT GST-K2 and mutant K2 (GST-K2LK47/AA) to actin immobilized on a CM5 biosensor chip. Lower concentrations of the K2 forms are shown in A and higher concentrations in B. (C) Steady-state binding curves for GST-K2 and GST-K2LK47/AA. Steady-state responses at the end of the association phase were used to determine K0.5. Data points are averages from duplicate runs from two independent experiments. RU, response unit.
Figure 6.
Figure 6.
The effect of K2 on actin filaments is visualized by Alexa Fluor 488–phalloidin staining. Actin was allowed to polymerize in the absence of K2 (negative control), in the presence of 1 µM α-actinin, a known actin bundling protein, or in the presence of K2 at 1 µM and K2LK47/AA at 1 and 6 µM. K2 forms used in these experiments had GST tag removed.
Figure 7.
Figure 7.
Effect of the LK47/AA mutation in K2 on integrin inside-out signaling. (A) Role of the ABS in F0 in inside-out signaling. CHO-A5 cells stably expressing integrin αIIbβ3 were in transfected with EGFP constructs for full-length WT K2 (E-K2), K2(LK47/AA) mutant, which diminishes its ABS in F0, or K2(QW615/AA) mutant, which diminishes its integrin-binding function (Ma et al., 2008). These K2 constructs were cotransfected with talin-H (TH), and integrin activation was quantified by flow cytometry based on PAC-1 binding, an antibody specific for activated αIIbβ3 (Shattil et al., 1985). Changes in integrin expression level were excluded with a mAb that reacts equally with the resting and active integrin. Data represent means ± SD of three independent experiments. n.s., not significant. (B) Visualization of actin in C2C12 cells after K2 knock-down with siRNA. C2C12 cells were spread on fibronectin in the presence of 3.5 mM MnCl2 for 30 min, fixed, and stained with Alexa Fluor 488–phalloidin. Bar, 20 µm. (C) Areas of cells were measured using ImageJ software, and 60 cells were quantified in each sample.
Figure 8.
Figure 8.
Effect of the LK47/AA mutation in K2 on integrin outside-in signaling. (A) Visualization of actin in C2C12 cells after K2 knock-down and rescue with EGFP-tagged WT K2. C2C12 cells were spread on fibronectin for 1 h, fixed, and stained with Alexa Fluor 568–phalloidin. Transfected cells were visualized with EGFP fluorescence. Transfected cells in righthand panels are identified with arrows. Bar, 20 µm. (B) Visualization of actin in C2C12 cells after K2 knock-down cotransfection with EGFP-tagged LK/AA K2 mutant. C2C12 cells were spread on fibronectin for 1 h, fixed, and stained with Alexa Fluor 568–phalloidin. Transfected cells were visualized with EGFP fluorescence. Transfected cells in righthand panels are indicated with arrows. Bar, 20 µm. (C) Quantitative analysis of C2C12 cell spreading coexpressing siRNA and EGFP-tagged K2 constructs. C2C12 cells were spread on fibronectin for 1 or 2 h, fixed, and stained with Alexa Fluor 568–phalloidin. The areas of EGFP-positive cells were measured using ImageJ software. *, P ≤ 0.001 vs. C2C12 control by Student’s t test. 40–50 cells were quantified in each sample from two independent experiments. (D) Western blot showing levels of expression of EGFP-tagged K2 constructs in OVCAR-3 cells. The blots were probed with anti-EGFP antibody and anti–β actin antibody as a loading control. EGFP alone was expressed at much higher levels than any K2 construct, and a lower exposure is shown for the EGFP blot (separated by the vertical line). (E) Quantitative analysis of OVCAR-3 cell spreading overexpressing WT K2 (E-K2), K2(LK47/AA), or K2(QW615/AA). OVCAR-3 cells were spread on 20 µg/ml fibronectin for 1 h, fixed, and stained with Alexa Fluor 633–phalloidin. Areas of EGFP-positive cells were measured using ImageJ software. *, P ≤ 0.001 vs. OVCAR-3 by Student’s t test. 40–50 cells were quantified in each sample in two independent experiments. (F) Actin organization in OVCAR-3 cells expressing K2 proteins. Cells were spread on fibronectin as described in F, and transfected cells were identified with EGFP fluorescence. Transfected cells are indicated with arrows in righthand panels. Bar, 20 µm.
Figure 9.
Figure 9.
Model of ABS in K2. (A) Ribbon diagram displaying the previously determined solution structure of K2 F0 (Perera et al., 2011). The LK47 residues within the ABS reside in a helix that extends from residues 31–51 that is colored in red. The residues that compose the previously identified charged phospholipid-binding interface are in blue. (B) Alignment of the actin-binding region in the F0 region of K2 with the corresponding regions of kindlin-1 and kindlin-3. LK47 has been boxed in all kindlins.

Similar articles

Cited by

References

    1. Algrain M., Turunen O., Vaheri A., Louvard D., and Arpin M.. 1993. Ezrin contains cytoskeleton and membrane binding domains accounting for its proposed role as a membrane-cytoskeletal linker. J. Cell Biol. 120:129–139. 10.1083/jcb.120.1.129 - DOI - PMC - PubMed
    1. Ali R.H., and Khan A.A.. 2014. Tracing the evolution of FERM domain of Kindlins. Mol. Phylogenet. Evol. 80:193–204. 10.1016/j.ympev.2014.08.008 - DOI - PubMed
    1. Bandyopadhyay A., Rothschild G., Kim S., Calderwood D.A., and Raghavan S.. 2012. Functional differences between kindlin-1 and kindlin-2 in keratinocytes. J. Cell Sci. 125:2172–2184. 10.1242/jcs.096214 - DOI - PMC - PubMed
    1. Bialkowska K., Ma Y.Q., Bledzka K., Sossey-Alaoui K., Izem L., Zhang X., Malinin N., Qin J., Byzova T., and Plow E.F.. 2010. The integrin co-activator Kindlin-3 is expressed and functional in a non-hematopoietic cell, the endothelial cell. J. Biol. Chem. 285:18640–18649. 10.1074/jbc.M109.085746 - DOI - PMC - PubMed
    1. Bledzka K., Bialkowska K., Nie H., Qin J., Byzova T., Wu C., Plow E.F., and Ma Y.Q.. 2010. Tyrosine phosphorylation of integrin beta3 regulates kindlin-2 binding and integrin activation. J. Biol. Chem. 285:30370–30374. 10.1074/jbc.C110.134247 - DOI - PMC - PubMed

Publication types

MeSH terms