

Globally conditioned Granger causality in brain-brain and brain-heart interactions: a combined heart rate variability/ultra-high-field (7 T) functional magnetic resonance imaging study
- PMID: 27044985
- PMCID: PMC4822445
- DOI: 10.1098/rsta.2015.0185
Globally conditioned Granger causality in brain-brain and brain-heart interactions: a combined heart rate variability/ultra-high-field (7 T) functional magnetic resonance imaging study
Abstract
The causal, directed interactions between brain regions at rest (brain-brain networks) and between resting-state brain activity and autonomic nervous system (ANS) outflow (brain-heart links) have not been completely elucidated. We collected 7 T resting-state functional magnetic resonance imaging (fMRI) data with simultaneous respiration and heartbeat recordings in nine healthy volunteers to investigate (i) the causal interactions between cortical and subcortical brain regions at rest and (ii) the causal interactions between resting-state brain activity and the ANS as quantified through a probabilistic, point-process-based heartbeat model which generates dynamical estimates for sympathetic and parasympathetic activity as well as sympathovagal balance. Given the high amount of information shared between brain-derived signals, we compared the results of traditional bivariate Granger causality (GC) with a globally conditioned approach which evaluated the additional influence of each brain region on the causal target while factoring out effects concomitantly mediated by other brain regions. The bivariate approach resulted in a large number of possibly spurious causal brain-brain links, while, using the globally conditioned approach, we demonstrated the existence of significant selective causal links between cortical/subcortical brain regions and sympathetic and parasympathetic modulation as well as sympathovagal balance. In particular, we demonstrated a causal role of the amygdala, hypothalamus, brainstem and, among others, medial, middle and superior frontal gyri, superior temporal pole, paracentral lobule and cerebellar regions in modulating the so-called central autonomic network (CAN). In summary, we show that, provided proper conditioning is employed to eliminate spurious causalities, ultra-high-field functional imaging coupled with physiological signal acquisition and GC analysis is able to quantify directed brain-brain and brain-heart interactions reflecting central modulation of ANS outflow.
Keywords: Granger causality; blood-oxygen-level dependent; brain–heart interactions; heart rate variability; ultra-high-field functional magnetic resonance imaging.
© 2016 The Author(s).
Figures
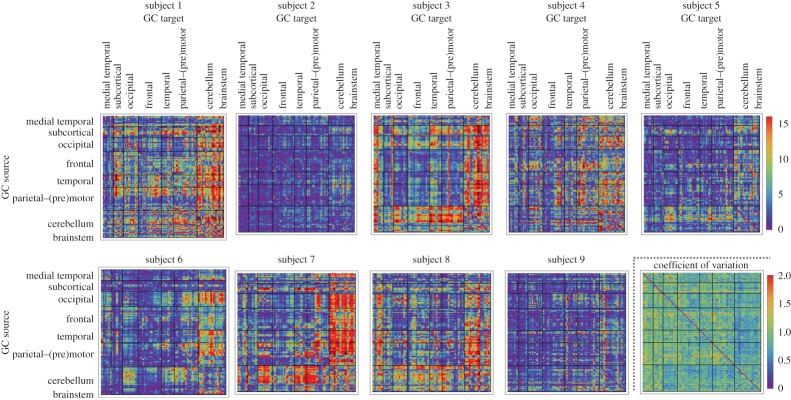
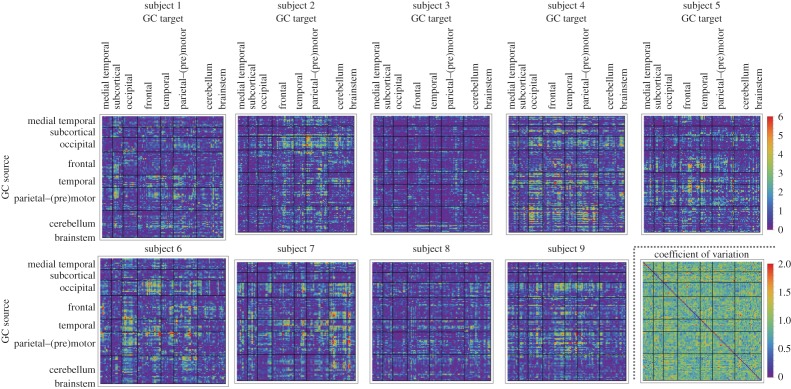
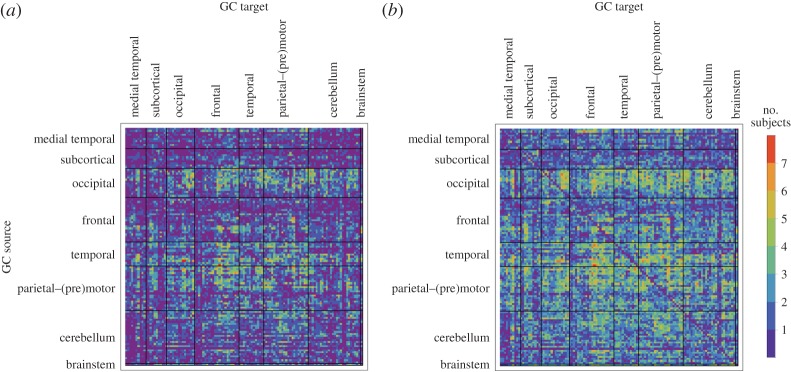
 (see equation (3.5)) of within-brain interactions. All nine subjects are shown. In each matrix, rows depict causing variables, whereas columns depict caused variables. Brain regions are ordered according to Salvador et al. [79]. The colour scale shows connection strength. (Online version in colour.)
References
-
- Langley JN. 1921. The autonomic nervous system. Cambridge, UK: W. Heffer & Sons Ltd.
Publication types
MeSH terms
Grants and funding
LinkOut - more resources
Full Text Sources
Other Literature Sources
Medical
Miscellaneous