

A Meta-Assembly of Selection Signatures in Cattle
- PMID: 27045296
- PMCID: PMC4821596
- DOI: 10.1371/journal.pone.0153013
A Meta-Assembly of Selection Signatures in Cattle
Abstract
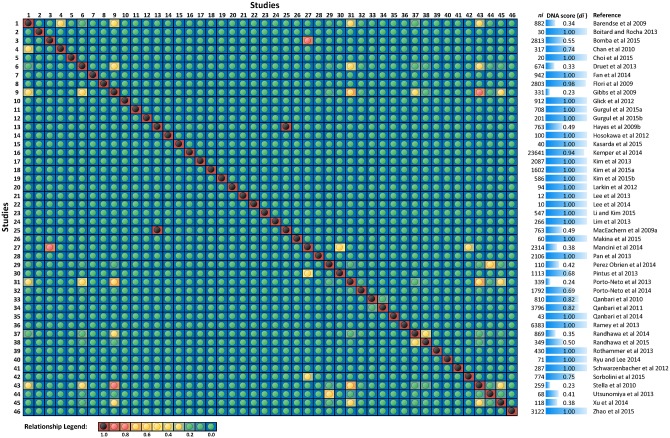
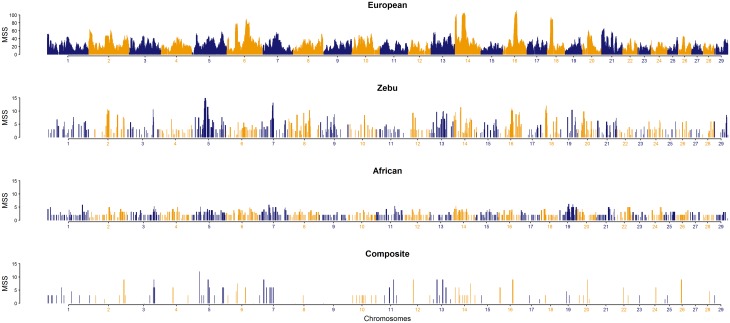
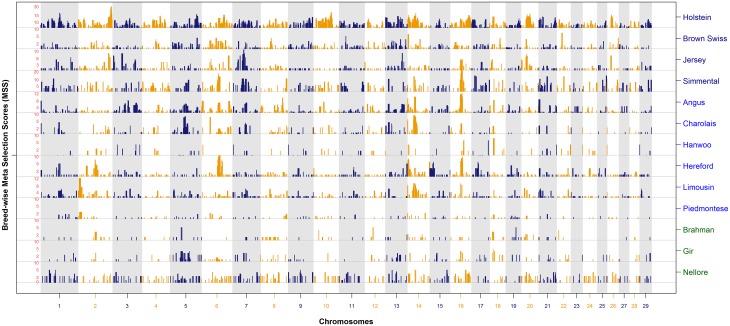
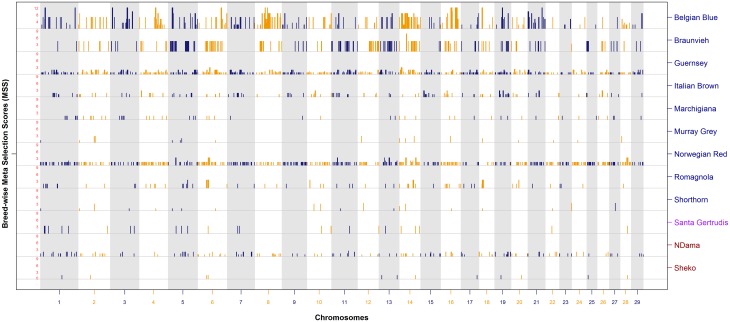
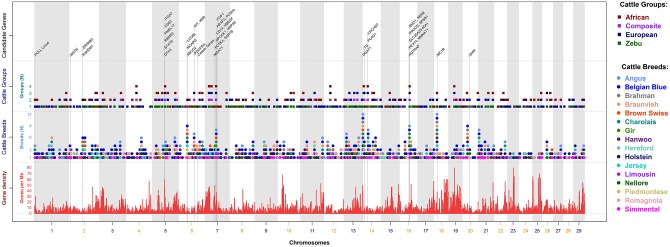
Since domestication, significant genetic improvement has been achieved for many traits of commercial importance in cattle, including adaptation, appearance and production. In response to such intense selection pressures, the bovine genome has undergone changes at the underlying regions of functional genetic variants, which are termed "selection signatures". This article reviews 64 recent (2009-2015) investigations testing genomic diversity for departure from neutrality in worldwide cattle populations. In particular, we constructed a meta-assembly of 16,158 selection signatures for individual breeds and their archetype groups (European, African, Zebu and composite) from 56 genome-wide scans representing 70,743 animals of 90 pure and crossbred cattle breeds. Meta-selection-scores (MSS) were computed by combining published results at every given locus, within a sliding window span. MSS were adjusted for common samples across studies and were weighted for significance thresholds across and within studies. Published selection signatures show extensive coverage across the bovine genome, however, the meta-assembly provides a consensus profile of 263 genomic regions of which 141 were unique (113 were breed-specific) and 122 were shared across cattle archetypes. The most prominent peaks of MSS represent regions under selection across multiple populations and harboured genes of known major effects (coat color, polledness and muscle hypertrophy) and genes known to influence polygenic traits (stature, adaptation, feed efficiency, immunity, behaviour, reproduction, beef and dairy production). As the first meta-assembly of selection signatures, it offers novel insights about the hotspots of selective sweeps in the bovine genome, and this method could equally be applied to other species.
Conflict of interest statement
Figures
Similar articles
-
Detection of selection signatures in dairy and beef cattle using high-density genomic information.Genet Sel Evol. 2015 Jun 19;47(1):49. doi: 10.1186/s12711-015-0127-3. Genet Sel Evol. 2015. PMID: 26089079 Free PMC article.
-
Composite Selection Signals for Complex Traits Exemplified Through Bovine Stature Using Multibreed Cohorts of European and African Bos taurus.G3 (Bethesda). 2015 Apr 30;5(7):1391-401. doi: 10.1534/g3.115.017772. G3 (Bethesda). 2015. PMID: 25931611 Free PMC article.
-
An interpretive review of selective sweep studies in Bos taurus cattle populations: identification of unique and shared selection signals across breeds.Front Genet. 2015 May 13;6:167. doi: 10.3389/fgene.2015.00167. eCollection 2015. Front Genet. 2015. PMID: 26029239 Free PMC article. Review.
-
Composite selection signals can localize the trait specific genomic regions in multi-breed populations of cattle and sheep.BMC Genet. 2014 Mar 17;15:34. doi: 10.1186/1471-2156-15-34. BMC Genet. 2014. PMID: 24636660 Free PMC article.
-
Non-lactational traits of importance in dairy cows and applications for emerging biotechnologies.N Z Vet J. 2005 Dec;53(6):406-15. doi: 10.1080/00480169.2005.36585. N Z Vet J. 2005. PMID: 16317441 Review.
Cited by
-
Whole Genome Scan Uncovers Candidate Genes Related to Milk Production Traits in Barka Cattle.Int J Mol Sci. 2024 Jun 2;25(11):6142. doi: 10.3390/ijms25116142. Int J Mol Sci. 2024. PMID: 38892330 Free PMC article.
-
Crossbreeding Simmental with Mongolian, and Holstein cattle can improve feed efficiency and energy metabolism by upregulating COX3 and downregulating PRSS2 gene expression.Front Nutr. 2025 Feb 21;12:1524242. doi: 10.3389/fnut.2025.1524242. eCollection 2025. Front Nutr. 2025. PMID: 40062232 Free PMC article.
-
Identifying loci under positive selection in complex population histories.Genome Res. 2019 Sep;29(9):1506-1520. doi: 10.1101/gr.246777.118. Epub 2019 Jul 30. Genome Res. 2019. PMID: 31362936 Free PMC article.
-
Evidence for and localization of proposed causative variants in cattle and pig genomes.Genet Sel Evol. 2021 Aug 30;53(1):67. doi: 10.1186/s12711-021-00662-x. Genet Sel Evol. 2021. PMID: 34461824 Free PMC article. Review.
-
Development and comparison of RNA-sequencing pipelines for more accurate SNP identification: practical example of functional SNP detection associated with feed efficiency in Nellore beef cattle.BMC Genomics. 2020 Oct 8;21(1):703. doi: 10.1186/s12864-020-07107-7. BMC Genomics. 2020. PMID: 33032519 Free PMC article.
References
-
- Ajmone-Marsan P, Garcia JF, Lenstra JA. On the origin of cattle: How aurochs became cattle and colonized the world. Evolutionary Anthropology: Issues, News, and Reviews. 2010;19(4):148–57. 10.1002/evan.20267 - DOI
-
- Andersson L, Georges M. Domestic-animal genomics: deciphering the genetics of complex traits. Nat Rev Genet. 2004;5(3):202–12. - PubMed
-
- Mirkena T, Duguma G, Haile A, Tibbo M, Okeyo AM, Wurzinger M, et al. Genetics of adaptation in domestic farm animals: A review. Livestock Science. 2010;132(1–3):1–12.
-
- Bruford MW, Bradley DG, Luikart G. DNA markers reveal the complexity of livestock domestication. Nat Rev Genet. 2003;4:900–10. - PubMed
Publication types
MeSH terms
LinkOut - more resources
Full Text Sources
Other Literature Sources
Research Materials
