. 2016 Aug;41(5):342-53.
doi: 10.1503/jpn.150154.

MicroRNA-326 acts as a molecular switch in the regulation of midbrain urocortin 1 expression

Affiliations

MicroRNA-326 acts as a molecular switch in the regulation of midbrain urocortin 1 expression

Armaz Aschrafi et al. J Psychiatry Neurosci. 2016 Aug.

Abstract

Background: Altered levels of urocortin 1 (Ucn1) in the centrally projecting Edinger-Westphal nucleus (EWcp) of depressed suicide attempters or completers mediate the brain's response to stress, while the mechanism regulating Ucn1 expression is unknown. We tested the hypothesis that microRNAs (miRNAs), which are vital fine-tuners of gene expression during the brain's response to stress, have the capacity to modulate Ucn1 expression.

Methods: Computational analysis revealed that the Ucn1 3' untranslated region contained a conserved binding site for miR-326. We examined miR-326 and Ucn1 levels in the EWcp of depressed suicide completers. In addition, we evaluated miR-326 and Ucn1 levels in the serum and the EWcp of a chronic variable mild stress (CVMS) rat model of behavioural despair and after recovery from CVMS, respectively. Gain and loss of miR-326 function experiments examined the regulation of Ucn1 by this miRNA in cultured midbrain neurons.

Results: We found reduced miR-326 levels concomitant with elevated Ucn1 levels in the EWcp of depressed suicide completers as well as in the EWcp of CVMS rats. In CVMS rats fully recovered from stress, both serum and EWcp miR-326 levels rebounded to nonstressed levels. While downregulation of miR-326 levels in primary midbrain neurons enhanced Ucn1 expression levels, miR-326 overexpression selectively reduced the levels of this neuropeptide.

Limitations: This study lacked experiments showing that in vivo alteration of miR-326 levels alleviate depression-like behaviours. We show only correlative data for miR-325 and cocaine- and amphetamine-regulated transcript levels in the EWcp.

Conclusion: We identified miR-326 dysregulation in depressed suicide completers and characterized this miRNA as an upstream regulator of the Ucn1 neuropeptide expression in midbrain neurons.


Figures
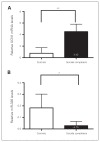
Fig. 1
Fig. 1
Urocortin 1 (UCN1) and microRNA (miR)-326 levels are altered in depressed suicide completers. (A) Quantitative real-time polymerase chain reaction (qRT-PCR)–based quantification of relative UCN1 messenger RNA levels in matched controls (white bar) and depressed suicide completers (black bar). (B) Quantitative RT-PCR-based quantification of relative miR-326 levels in matched controls and depressed suicide completers reveals decreased miR-326 expression levels in suicide completers. The relative expression levels were normalized to the expression of the housekeeping genes small nuclear RNA U6 and β-actin. *p < 0.05, **p < 0.01, 1-way analysis of variance.
Fig. 2
Fig. 2
Downregulation of microRNA (miR)-326 and miR-325 expression and upregulation of urocortin 1 (Ucn1) and cocaine- and amphetamine-regulated transcript (CART) messenger RNA levels in chronic variable mild stress (CVMS)–exposed rats. (A) Quantitative real-time polymerase chain reaction (qRT-PCR)–based quantification of relative Ucn1 and CART mRNAs and miR-326 and miR-325 expression levels in the Edinger–Westphal nucleus (EWcp) revealed increased expression for both Ucn1 and CART mRNA in CVMS-exposed rats (black bars) compared with control rats (white bars). The miR-326 levels decreased in CVMS-exposed compared with control rats. Bars indicate means ± standard errors of the mean (SEM) of 8 animals per group. The relative expression levels were normalized to the expression of small nuclear RNA (snRNA) U6 and β-actin. The control group is set at 100%. *p < 0.05, **p < 0.01, ***p < 0.001, 1-way analysis of variance. (B) The miR-326 and miR-325 expression in the EWcp of control and recovered CVMS-treated rats. Quantitative RT-PCR-based quantification of miR-326 and miR-325 expression levels in the EWcp of stress-recovered rats suggest that the levels of these miRNAs are returning to basal levels. Bars indicate means ± SEM of 8 animals per group. The relative expression levels were normalized to the expression of the housekeeping genes snRNA U6 and β-actin. (C) The Ucn1 mRNA and miR-326 levels exhibited a negative expression correlation as represented by Pearson correlation analysis. (D) CART mRNA and miR-326 expression levels exhibited a negative correlation as represented by Pearson correlation analysis within different groups. (E) CART mRNA levels showed a positive correlation with Ucn1 mRNA levels. (F) MicroRNA-326 colocalizes with Ucn1 neuropeptides in the same neurons of the EWcp in rats. The left and middle panels are photomicrographs of (left) mirror-adjacent sections depicting Unc1 immunoreactivity and (middle) expression of miR-326. The arrows point to cells colocalizing Ucn1 and miR-326. Asterisks depict corresponding blood vessels as orientation points in the adjacent slides. (Right) In situ hybridization using a scrambled miR control probe in the EWcp. Aq = cerebral aqueduct. Scale bar = 25 μm.
Fig. 3
Fig. 3
Elevation of microRNA (miR)-326 levels in the chronic variable mild stress (CVMS) rat serum. The expression levels of miR-326 in control, CVMS and CVMS-recovered rat serums were normalized to both small nuclear RNA U6 and β-actin. Bars indicate means ± standard errors of the mean of 8 animals per group. ***p < 0.001, 1-way analysis of variance.
Fig. 4
Fig. 4
MicroRNA (miR)-326 targets the 3′-untranslated region (UTR) of urocortin 1 (Ucn1) mRNA. (A) PmirGLO plasmid carrying renilla and firefly luciferase reporter genes (Control). The intact Ucn1 3′-UTR (Ucn1) or the Ucn1 3′-UTR lacking the miRNA-binding seed sequence (MTS) were subcloned downstream from a firefly luciferase reporter construct driven by the human phosphoglyserate kinase (PGK) promoter. Renilla expression is driven by an independent Simian vacuolating virus 40 (SV40) early promoter, and is followed by a late SV40 poly(A) region. (B) Luciferase activity for control and Ucn1 plasmids cotransfected with mimic-miR-nt (white bars), or mimic-miR-326 (black bars). Luciferase activity was decreased upon cotransfection of Ucn1 and mimic-miR-326. (C) Luciferase activity for control and Ucn1 plasmids cotransfected with anti-miR-nt (white bars) or anti-miR-326 (black bars). Luciferase activity was increased upon cotransfection of Ucn1 and anti-miR-326. (D) Luciferase activity for control and MTS plasmids cotransfected with mimic-miR-nt or mimic-miR-326 was similar among all conditions. (E) Luciferase activity for control and MTS plasmid cotransfected with anti-miR-nt or anti-miR-326 was similar for all conditions. Firefly luciferase activities were normalized against renilla luciferase activities to calculate relative light units. Error bars represent the standard errors of the mean 8 independent experiments. Relative light units of the control group were considered 100%. **p < 0.01, 1-way analysis of variance.
Fig. 5
Fig. 5
MicroRNA (miR)-326 regulates urocortin 1 (Ucn1) messenger RNA and protein expression in neurons. (A) In rat primary midbrain neurons, Ucn1 mRNA levels are decreased upon mimic-miR-326 transfection (black bar) compared with mimic-miR-nt transfection (white bar), as determined by quantitative real-time polymerase chain reaction (qRT-PCR)–based quantification. Error bars represent the standard errors of the mean (SEM) for 6 independent experiments. (B) Ucn1 mRNA levels are increased in primary midbrain neurons transfected with anti-miR-326 (black bar) compared with anti-miR-nt transfected neurons (white bar). The relative expression levels were normalized to the expression of the housekeeping genes small nuclear RNA U6 and β-actin. Error bars represent the SEM for 6 independent experiments. (C) Left panels show representative pictures of primary midbrain neurons cotransfected with the mCherry vector together with either miR-nt or miR-326 mimics. (D) Fluorescence-based quantification of Ucn1 protein levels in mCherry-miR-nt (white bar) or mCherry-miR-326 (black bar) transfected midbrain neurons revealed a decrease in Ucn1 protein levels upon miR-326 overexpression. (E) Representative pictures of midbrain neurons cotransfected with the mCherry vector together with either anti-miR-nt or anti-miR-326. (F) Fluorescence-based quantification of Ucn1 protein levels upon transfection with anti-miR-nt or anti-miR-326 demonstrating increased Ucn1 protein levels upon anti-miR-326 transfection. Analysis of immunofluorescence levels was performed by using ImageJ. Error bars represent the SEM for 4 independent experiments, each assessing fluorescence levels of 50–60 neurons. Control relative expression levels were set to 100%. *p < 0.05, **p < 0.01, ***p < 0.001, 1-way analysis of variance.

References

    1. Turecki G. The molecular bases of the suicidal brain. Nat Rev Neurosci. 2014;15:802–16. - PMC - PubMed
    1. Turecki G. Epigenetics and suicidal behavior research pathways. Am J Prev Med. 2014;47(Suppl 2):S144–51. - PMC - PubMed
    1. Levinson DF. The genetics of depression: a review. Biol Psychiatry. 2006;60:84–92. - PubMed
    1. de Kloet ER, Joels M, Holsboer F. Stress and the brain: from adaptation to disease. Nat Rev Neurosci. 2005;6:463–75. - PubMed
    1. Krishnan V, Nestler EJ. The molecular neurobiology of depression. Nature. 2008;455:894–902. - PMC - PubMed