. 2016 Apr 5:6:23947.
doi: 10.1038/srep23947.

Optogenetic approaches addressing extracellular modulation of neural excitability

Affiliations

Optogenetic approaches addressing extracellular modulation of neural excitability

Emily A Ferenczi et al. Sci Rep. .

Abstract

The extracellular ionic environment in neural tissue has the capacity to influence, and be influenced by, natural bouts of neural activity. We employed optogenetic approaches to control and investigate these interactions within and between cells, and across spatial scales. We began by developing a temporally precise means to study microdomain-scale interactions between extracellular protons and acid-sensing ion channels (ASICs). By coupling single-component proton-transporting optogenetic tools to ASICs to create two-component optogenetic constructs (TCOs), we found that acidification of the local extracellular membrane surface by a light-activated proton pump recruited a slow inward ASIC current, which required molecular proximity of the two components on the membrane. To elicit more global effects of activity modulation on 'bystander' neurons not under direct control, we used densely-expressed depolarizing (ChR2) or hyperpolarizing (eArch3.0, eNpHR3.0) tools to create a slow non-synaptic membrane current in bystander neurons, which matched the current direction seen in the directly modulated neurons. Extracellular protons played contributory role but were insufficient to explain the entire bystander effect, suggesting the recruitment of other mechanisms. Together, these findings present a new approach to the engineering of multicomponent optogenetic tools to manipulate ionic microdomains, and probe the complex neuronal-extracellular space interactions that regulate neural excitability.


Figures

Figure 1
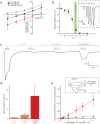
Figure 1. Light-activation of three acid-sensitive ion channels.
(a) Principle of the two-component optogenetic (TCO) approach. Upon illumination the light-activated proton pump may moderately acidify the local extracellular medium and activate acid-sensitive ion channels, ASICs, via their proton-sensing domain. This results in a remote but large sodium influx that can be used for sustained cell depolarization at moderate light intensities. In Xenopus oocytes, a light-driven proton pump of Coccomyxa subellipsoidea (CsR) was used. (b–d) Macroscopic currents of CsRT46N coexpressed with rat ASIC1a (b), rat ASIC2a (c) or rat ASIC3 (d) in oocytes at a molar RNA ratio of 1:1 (for ASIC3 of 2:1). Cells were illuminated with 560 nm light at different holding voltages at 0.1 mM MOPS and pH 7.5 under constant perfusion. The small outward directed pump currents (CsR) triggers large inward sodium currents (ASIC). Inset is a zoom-in to the initial pump activity directly after starting to illuminate CsRT46N-ASIC1a with green light. Note that ASIC1a and ASIC3 show strong inactivation in sustained light, whereas ASIC2a shows moderate to no inactivation at all.
Figure 2
Figure 2. Characterization of CsR-ASIC2a by two-electrode voltage clamp (TEVC) recordings in oocytes.
(a) Current-voltage dependency of normalized photocurrents in 100 mM NaCl, 100 mM KCl or 100 mM CholineCl extracellular medium (all media contained additionally 1mM NaCl/KCl, 1 mM MgCl2, 0.1 mM CaCl2 and 0.1 mM MOPS, pH 7.5, normalized to ASIC2a current activated by pH 4, mean +/− SD, n = 5). (b) ASIC2a currents measured during pH titration in darkness and comparison with photocurrents measured at pH 7.5 (mean +/− SD, n = 6). The green shaded region highlights the percent activation of ASIC2a by illumination with green light at 0.1 mM MOPS at −40 mV (data shown in Fig. 5d). Inset: representative pH activated current trace of ASIC2a at −40 mV. (c) Macroscopic currents of CsRT46N-ASIC2a activated by pH 4 or green light at different buffer concentrations (5 mM MOPS, 1 mM MOPS and 0.1 mM MOPS, −40 mV, constant perfusion). (d) Percent activation of ASIC2a by the light driven proton pump CsRT46N in different buffer concentrations (5 mM MOPS, 1 mM MOPS and 0.1 mM MOPS, −40 mV, n = 9, 100% activation taken as the peak ASIC current produced by pH 4, mean +/− SD, n = 9). (e) Normalized ASIC2a (red data points) and CsRT46N (green data points) photocurrents measured at different light intensities (0.1 mM MOPS, −40 mV, normalized to ASIC2a current activated by pH 4, mean +/− SD, n = 5). Inset: representative current traces at −40 mV.
Figure 3
Figure 3. eArch3.0-ASIC2a (Channel and Pump, Champ) expression in cultured hippocampal neurons.
(a) Two-component Champ2.0 construct containing eArch (enhanced by trafficking sequence, TS) and ASIC2a, separated by a linker sequence and labeled with YFP. (b) Champ2.0 expression under CamKIIα or human synapsin (hSyn) promoters. (c) Representative voltage clamp trace for a Champ-expressing cell in response to a 1 s pulse of 560 nm light (green horizontal line). (d) Magnitude of outward (mean +/− SEM = 246 +/− 27 pA) and inward (−950 +/− 172 pA) components of the Champ current to a 1 s pulse of 560 nm light (n = 21). (e) Relationship between inward and outward components of the current (n = 21). Linear regression analysis yields R2 = 0.33, p = 0.006 for difference of slope from zero (F(1, 19) = 9.447). (f) Example Champ responses to a 15 s light pulse in standard (25 mM HEPES, black trace) and weakly buffered (0.1 mM HEPES, grey trace) extracellular solution. (g) Peak inward currents in 25 and 0.1 mM HEPES for 1 s and 15 s light pulses. For 15 s light pulses, mean inward current is −164 pA +/−45 at 25 mM (n = 5) versus −379.9 +/−83 pA at 0.1 mM (n = 6), unpaired t-test with Welch’s correction: t = 2.278, df = 7.558, p = 0.0541). (h) Decay of inward current (final to peak current ratio for 15 s light pulse) in 25 mM (n = 5) versus 0.1 mM HEPES (n = 6), unpaired t-test with Welch’s correction: t = 4.779, df = 5.997, p = 0.0031. (i) Example membrane potential response to 1 s pulse of 560 nm light (green horizontal line) for a Champ expressing cell recorded in current clamp. (j) Magnitude of hyperpolarizing (eArch3.0-mediated, −33 +/− 3 mV) and depolarizing (ASIC2a-mediated, 87 +/− 6 mV) components of the light response (n = 13). (k) Relationship between Champ-mediated membrane hyperpolarization and depolarization (for 1 s light pulses). Linear regression analysis yields R2 = 0.47, p = 0.0093 for difference of slope from zero (F(1, 11) = 9.885).
Figure 4
Figure 4. Head-to-head comparison of four different Champ constructs in which the proton pump and ASIC are separated by increasing primary-sequence distance.
For each construct: a cartoon illustrates the structure of the two-component construct, confocal images demonstrate fluorescence expression in culture and graphs show the relative magnitude of the peak outward current and the current at the end of the light pulse. A more negative current at the end of the light pulse indicates a larger ASIC component. Insets: representative traces of the current responses to a 1 s pulse of 560 nm light for each two-component construct (timing of light pulse indicated by green horizontal line). All electrophysiological recordings were performed in low HEPES (0.1 mM) Tyrode’s solution. (a) eArch3.0-YFP only control (n = 9). (b) Co-transfection of eArch3.0 and ASIC2a: eArch3.0 is labeled with mCherry and ASIC2a is labeled with YFP to allow identification of both components in a single cell (n = 9). (c) Champ1.0: eArch3.0 and ASIC2a are separated during protein translation by the ribosomal skip sequence, p2A (n = 14). (d) Champ2.0: eArch3.0 and ASIC2a are fused by a 41 amino acid linker sequence (n = 17). (e) Champ3.0: eArch3.0 and ASIC2a are fused by a short linker sequence (23 amino acid membrane trafficking signal, TS) (n = 16).
Figure 5
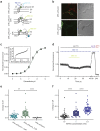
Figure 5. pH changes at the extracellular membrane surface in HEK293 cells.
(a) Protein architectures of bHK_pHluorin (ß-subunit of the HK-ATPase fused to superecliptic pHluorin), bHK_pHluorin_CsR (bHK_pHluorin fused to the N-terminus of CsR T46N) and bHK_pHluorin + CsR (bHK_pHluorin coexpressed with CsR_T46N_eCFP via a P2A cleavage site). (b) Confocal images of bHK_pHluorin and bHK_pHluorin_CsR (pHluorin in green, Rhodamine18 membrane marker in red (only for bHK_pHluorin)). (c) Normalized fluorescence of bHK_pHluorin as a function of extracellular pH (mean +/− SD, n = 9). Inset: Extracellular pH dependence on normalized fluorescence. (d) Experimental protocol for the measurement of extracellular pH changes: bHK_pHluorin_CsR was illuminated for 15 s by 560 nm light with simultaneous fluorescence measurements of pHluorin (480 nm excitation pulses) (mean +/− SEM, n = 25), calibrated by fluorescence measurements at pH 9 and pH 5. (e) Extracellular pH changes after 560 nm light in 1 mM HEPES in absence of a proton pump (bHK_pHluorin, n = 10), in direct vicinity to a proton pump (bHK_pHluorin_CsR, n = 35) and on the overall membrane surface in presence of CsR_T46N, (bHK_pHluorin + CsR, n = 27) (box represents 25% to 75% percentile, empty square represents mean + − SD, two sample t-test with Welch’s correction with t = −3.1l, df = 47.7, p = 0.0032 for the comparison of bHK_pHluorin + CsR to bHK_pHluorin_CsR and t = 5.97, df = 36.17, p < 0.0001 for the comparison of bHK_pHluorin_CsR to bHK_pHluorin). (f) pH changes in direct vicinity to CsR T46N measured with bHK_pHluorin_CsR in different extracellular proton buffer concentrations (n = 35, two-sample paired t-test with t = −6.24, df = 34, p < 0.0001 for the comparison of 10 mM HEPES to 1 mM HEPES and t = −7.03, df = 34, p < 0.0001 for the comparison of 1 mM HEPES to 0.1 mM HEPES). Photocurrents of the proton pump constructs were comparable but variable and overall small reflecting the small pH changes observed with the fluorescent dye (45 +− 30 pA for bHK_pHluorin_CsR and 55 +− 45 pA for the CsR_eCFP_P2A_bHK_pHluorin split construct).
Figure 6
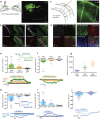
Figure 6. The bystander effect.
(a) Unilateral injection of AAV5-CamKII-(opsin)-eYFP into CA1 of hippocampus yielded non-expressing bystander neurons in the contralateral hippocampus (location represented by red star). (b) Biocytin-filled hippocampal bystander neurons in CA1. (c) Bystander neurons in superficial cortex of Thy1-ChR2 (line 18) transgenic mice (location represented by red star). (d) Bystander neuron surrounded by but not overlapping with YFP expression. (e) Hyperpolarizing bystander currents (30 s 560 nm light) for eArch3.0 (21 +/− 4 pA, n = 12, p < 0.0001), 590 nm for eNpHR3.0 (10 +/− 2 pA, n = 14, p < 0.0001) and YFP controls (1.3 +/− 0.8 pA, n = 10, 560 nm). Inset: Comparison with eArch3.0 photocurrent. (f) Hyperpolarizing bystander potentials for eArch3.0 (−3.3 +/− 1.1 mV, n = 12, p < 0.0001, eNpHR3.0 (−1.1 +/− 0.2 mV, n = 12, p < 0.001, and YFP controls (−0.1 +/− 0.2 mV, n = 9). (g) Onset kinetics (τon) for depolarizing (ChR2: 1800 +/− 200 ms, n = 8) and hyperpolarizing (eArch3.0: 4800 +/− 710 ms, n = 10, eNpHR3.0: 8300 +/− 850 ms, n = 7) bystanders. (h) Depolarizing bystander currents (15 s 470 nm light) for ChR2 hippocampal bystanders (mean +/− SEM = −155 +/− 32 pA, n = 11, p < 0.0001), Thy1-ChR2 cortical bystanders (−27 +/− 6 pA, n = 6, p < 0.001) and YFP controls (0.7 +/− 0.7 pA, n = 10). Inset: Comparison with ChR2 photocurrent. (i) Depolarizing bystander potentials for ChR2 hippocampal bystanders (6.1 +/− 1.4 mV, n = 11, p < 0.0001), Thy1-ChR2 bystanders (2.7 +/− 0.6 mV, n = 3, p < 0.01) and YFP controls (0.02 +/− 0.07 mV, n = 9). Bystander currents for 470 nm pulse trains at 20 Hz (−73 +/− 18 pA, n = 12) and 10 Hz (−29 +/− 6 pA, n = 11). Statistical comparison are between opsin and YFP control groups using the Mann Whitney unpaired t-test. Data are from a total of 22 animals.
Figure 7
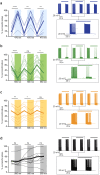
Figure 7. Functional impact of bystander currents in neurons at spike threshold.
To facilitate effect detection, spikes were evoked in the bystander neuron by intracellular injection of electrical current pulses at 10 Hz with current magnitudes titrated to spike threshold, to achieve ~50% spike success rate at baseline. In dense opsin-expressing regions, light stimulation was then applied and the change in evoked spiking of bystander neurons was recorded. Plots show percentage of successfully evoked spikes during repeated light-off and light-on epochs for (a), AAV-ChR2 (RM one-way ANOVA: F = 28.78, n = 10 cells, p < 0.0001). (b) AAV-eArch3.0 (F = 12.16, n = 13 cells, p < 0.0001). (c) AAV-eNpHR3.0 (F = 8.361, n = 9, p = 0.030). (d) AAV-YFP control bystander neurons (F = 2.813, n = 8 cells, p = 0.1197). In summary plots (left), thick lines indicate group mean and thin lines indicate individual cell data. Example traces are shown (right) with dashed box containing zoom-in of the center light-off/light-on epoch. For bystander neurons in which baseline spike success was not near threshold, these significant effects of light on evoked spiking were not observed (not shown). Statistical comparisons were performed using a repeated measures one-way ANOVA (for 6 alternating treatments, 3 light off, 3 light on) with Tukey’s multiple comparison test. Asterisks represent significant differences after multiple comparison correction. Significance thresholds were set at p < 0.05 (*), p < 0.01 (**), p < 0.001 (***) and p < 0.0001 (****). Data are from a total of 23 animals.
Figure 8
Figure 8. The contribution of acid-sensing ion channels to the bystander effect.
(a,b) ASIC1 (a) and ASIC2a (b) expression in CA1. (c) Change in membrane resistance during amiloride (ASIC antagonist) application (lilac-shaded region) (n = 6–18 cells, 9 mice, two-way ANOVA for interaction between time and drug treatment (F (12,314) = 2.617, p = 0.0018, asterisks indicate significant time points after Dunnet’s multiple comparison test). Grey data points: control experiment in which no amiloride was applied (n = 4–16, 6 mice) (no significant change from baseline). (d) Change in bystander current during amiloride application (F (12,314) = 2.473, p = 0.0032, asterisks indicate significant time points). No significant change from baseline for untreated control cells. (e) Examples bystander current at baseline baseline (dark red), after 20 mins amiloride (pink), and after 30 mins of washout (lilac). (f) Example ChR2 and eArch3.0 bystander currents in 500 μM acetazolamide (pale traces indicate baseline recordings, dark traces indicate 15 mins acetazolamide exposure). (g) Change in bystander current magnitude after acetazolamide application (thick line represents group mean) (ChR2, n = 7 cells, 3 mice, paired t-test: t = 1.313, df = 6, p = 0.2372; eArch3.0, n = 7 cells, 3 mice, paired t-test: t = 6.177, df = 6, p = 0.0008). (h) Occasionally, acetazolamide caused eArch3.0 bystander neurons to exhibit inward ASIC-like currents during green light. (i) Extracellular pH measurements in CA1 (contralateral to site of opsin injection) in acute slices using a solid state metal wire oxide pH sensor (100 μm diameter, 5X magnification). (j) pH change in response to three minutes of light stimulation (470 nm for ChR2 and YFP-controls, 560 nm for eArch3.0). For ChR2, n = 24 recording sites, 13 slices, 3 animals. For eArch3.0, n = 21 recording sites, 11 slices, 3 animals. For YFP controls, n = 22 recording sites, 12 slices, 2 animals. (k) Zoom-in of last minute of baseline pH recording and first two minutes of light stimulation.

Similar articles

Cited by

References

    1. Hodgkin A. L. & Katz B. The effect of sodium ions on the electrical activity of the giant axon of the squid. J. Physiol. 108, 37–77 (1949). - PMC - PubMed
    1. Hodgkin A. L. & Huxley A. F. A quantitative description of membrane current and its application to conduction and excitation in nerve. J. Physiol. 117, 500–544 (1952). - PMC - PubMed
    1. Baylor D. A. & Nicholls J. G. Changes in extracellular potassium concentration produced by neuronal activity in the central nervous system of the leech. J. Physiol. 203, 555–569 (1969). - PMC - PubMed
    1. Poolos N. P., Mauk M. D. & Kocsis J. D. Activity-Evoked Increases in Extracellular Potassium Modulate Presynaptic Excitability in the CA1 Region of the Hippocampus. J. Neurophysiol. 58, 404–416 (1987). - PubMed
    1. Krishtal O. A., Osipchuk Y. V., Shelest T. N. & Smirnoff S. V. Rapid extracellular pH transients related to synaptic transmission in rat hippocampal slices. Brain Res. 436, 352–356 (1987). - PubMed

MeSH terms