. 2016;12(3):565-78.
doi: 10.1080/15548627.2016.1145325.

Lysosomal putative RNA transporter SIDT2 mediates direct uptake of RNA by lysosomes

Affiliations

Lysosomal putative RNA transporter SIDT2 mediates direct uptake of RNA by lysosomes

Shu Aizawa et al. Autophagy. 2016.

Abstract

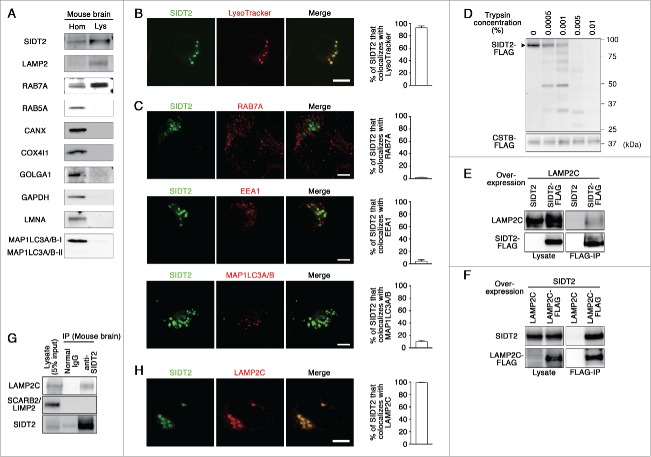
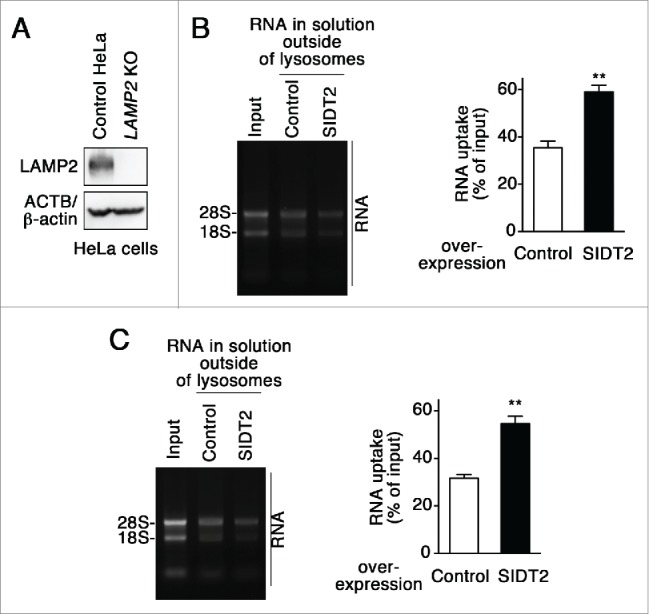
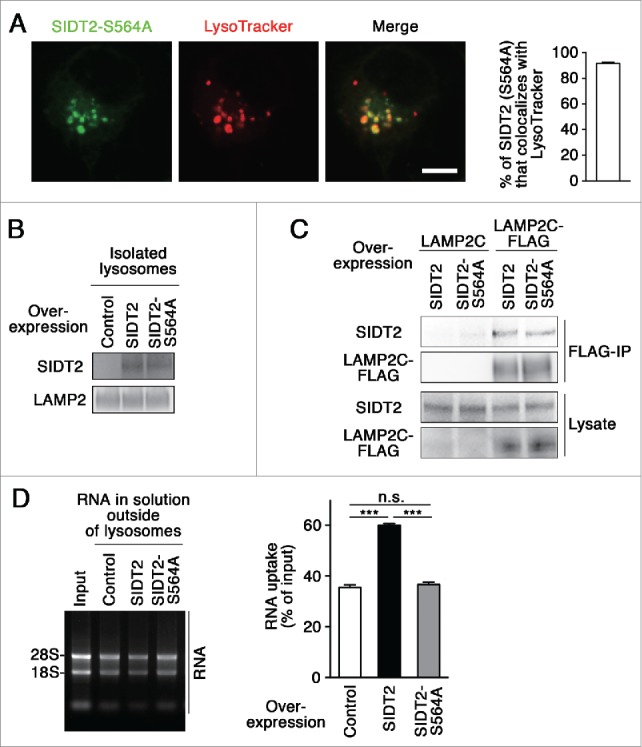
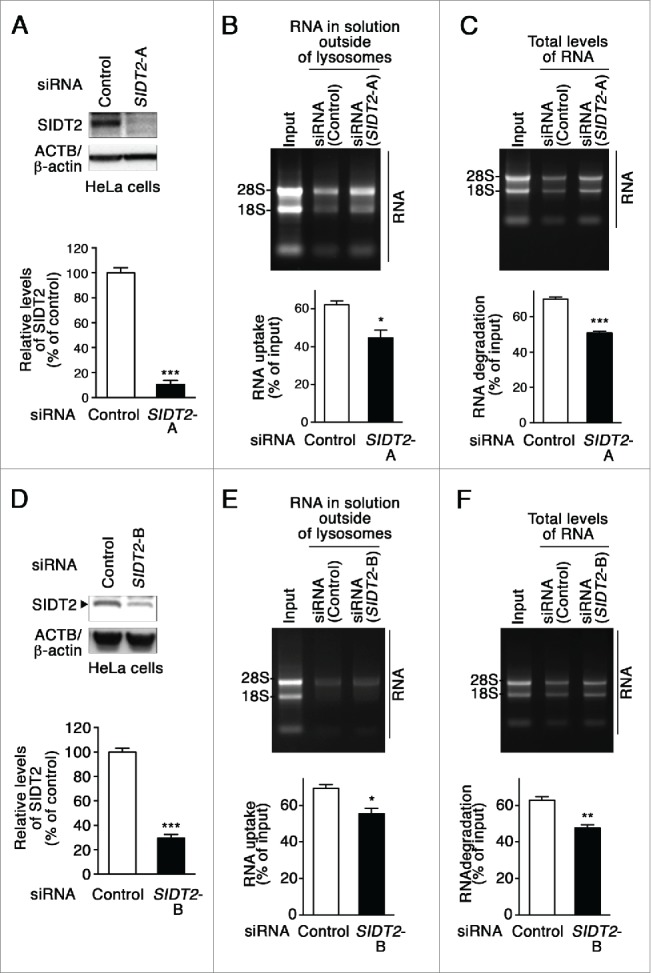
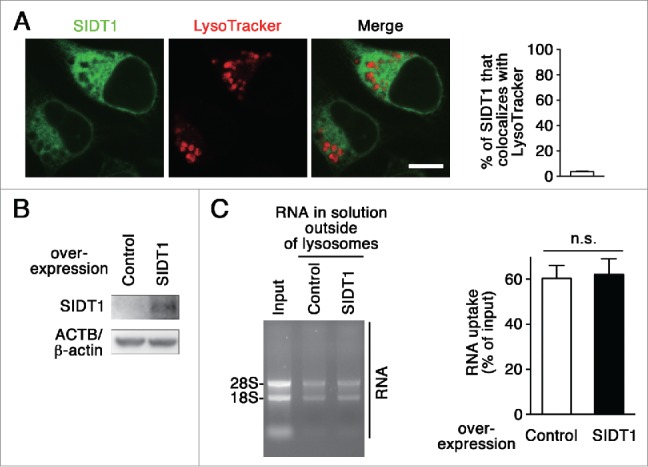
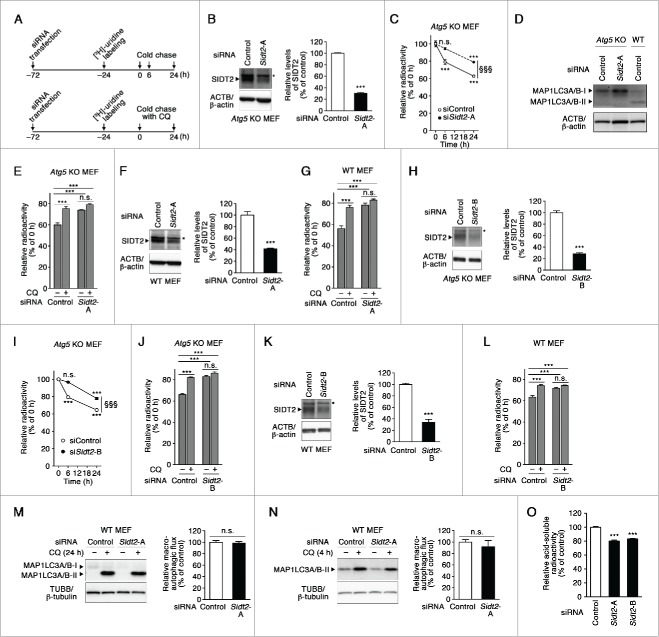
Lysosomes are thought to be the major intracellular compartment for the degradation of macromolecules. We recently identified a novel type of autophagy, RNautophagy, where RNA is directly taken up by lysosomes in an ATP-dependent manner and degraded. However, the mechanism of RNA translocation across the lysosomal membrane and the physiological role of RNautophagy remain unclear. In the present study, we performed gain- and loss-of-function studies with isolated lysosomes, and found that SIDT2 (SID1 transmembrane family, member 2), an ortholog of the Caenorhabditis elegans putative RNA transporter SID-1 (systemic RNA interference deficient-1), mediates RNA translocation during RNautophagy. We also observed that SIDT2 is a transmembrane protein, which predominantly localizes to lysosomes. Strikingly, knockdown of Sidt2 inhibited up to ˜50% of total RNA degradation at the cellular level, independently of macroautophagy. Moreover, we showed that this impairment is mainly due to inhibition of lysosomal RNA degradation, strongly suggesting that RNautophagy plays a significant role in constitutive cellular RNA degradation. Our results provide a novel insight into the mechanisms of RNA metabolism, intracellular RNA transport, and atypical types of autophagy.

Keywords: RNA; RNautophagy; autophagy; lysosome; membrane protein.


Figures

Figure 1.
Figure 1.
Characterization of SIDT2. (A) Lysosomes (Lys) were isolated from mouse brain homogenates (Hom), and analyzed by immunoblotting using polyclonal goat anti-SIDT2 antibody and antibodies against LAMP2 (lysosomal marker), RAB7A (late endosome and lysosome), RAB5A (early endosome), CANX (endoplasmic reticulum), COX4I1 (mitochondria), GOLGA1 (Golgi apparatus), GAPDH (cytosol), LMNA/lamin A (nuclei), and MAP1LC3A/B (autophagosome). (B) Neuro2a cells expressing GFP-tagged SIDT2 were incubated with LysoTracker Red. Fluorescence images were visualized using a confocal laser-scanning microscope. Scale bar: 10 μm. Colocalization rate was quantified using ImageJ software (right panel, n = 3). (C) Neuro2a cells expressing GFP-tagged SIDT2 were fixed, and immunostained using anti-RAB7A, anti-EEA1 (early endosomal marker) or anti-MAP1LC3A/B antibodies. Fluorescent images were obtained using confocal microscopy. Scale bars: 5 μm. Colocalization rate was quantified (right panels, n = 3). (D) Lysosomes were isolated from HeLa cells expressing SIDT2-FLAG or CTSB-FLAG. Isolated lysosomes (4 μg protein) were incubated with the indicated concentrations of trypsin at 37°C for 5 min. Proteins in the samples were analyzed by immunoblotting using an anti-FLAG antibody. (E) LAMP2C and SIDT2 or SIDT2-FLAG were overexpressed in HeLa cells. Cell lysates were prepared and immunoprecipitated with an anti-FLAG antibody. Cell lysates and the resulting immunoprecipitant were analyzed by immunoblotting. (F) Lysates were prepared from HeLa cells overexpressing SIDT2 and LAMP2C or LAMP2C-FLAG and coimmunoprecipitation assays performed. (G) Endogenous interaction of SIDT2 with LAMP2C. Coimmunoprecipitation assays were performed using mouse brain lysates. (H) Neuro2a cells coexpressing FLAG-tagged LAMP2C and GFP-tagged SIDT2 were fixed, and immunostained using anti-FLAG antibody. Scale bars: 10 μm. Colocalization rate was quantified (right panel, n = 3).
Figure 2.
Figure 2.
Effects of SIDT2 overexpression on RNA uptake and degradation by lysosomes. (A and B) Outlines of RNA uptake assays (A) and RNA degradation assays (B) using isolated lysosomes. (C) SIDT2 was overexpressed in Neuro2a cells. Protein levels were analyzed by immunoblotting using a goat anti-SIDT2 antibody. (D) The RNA uptake assay I indicated in (A) was performed using 5 μg of total RNA derived from mouse brains and isolated lysosomes derived from cells overexpressing SIDT2, or from control cells transfected with empty vector. Relative RNA levels in the solution outside lysosomes were quantified, and levels of RNA uptake were measured by subtracting RNA levels remaining in solution outside lysosomes from RNA input levels. Mean values are shown with SEM (n = 3). ***, P < 0.001. (E) RNA uptake assay II was performed as indicated in (A). Relative levels of RNA resistant to exogenous RNase A were analyzed. Mean ± SEM (n = 3). *, P < 0.05. (F) Isolated lysosomes were incubated with RNA and ATP as indicated in (A). Post-embedding immunoelectron microscopy was performed using an anti-rRNA antibody followed by anti-mouse IgG coupled with 10-nm gold particles. Gold particles were observed in the lysosomes. The numbers of gold particles per lysosome were counted. Mean ± SD (n = 25). ***, P < 0.001. Scale bars: 200 nm. (G) RNA degradation assays were performed as indicated in (B). Total RNA levels in samples were quantified, and levels of RNA degradation were measured by subtracting the RNA levels remaining in samples from the levels of input RNA. Mean ± SEM (n = 3). ***, P < 0.001. (H) Degradation of various RNAs by isolated lysosomes. RNA degradation assays were performed as described in Fig. 2B. Relative levels of RNAs in samples were measured by qPCR analyses. Mean values are shown with SEM (n = 3). Actb, β-actin. *, P < 0.05; **, P < 0.01; ***, P < 0.001, n.s., not significant (Tukey test or Fisher LSD test). (I) Degradation of 28S and 18S rRNAs by isolated lysosomes. RNA degradation assays were performed using total RNA that does not contain small RNAs (under 200 bases). Undegraded and partially degraded RNAs were visualized using ethidium bromide staining (left). Relative levels of rRNAs (28S and 18S) were quantified, and levels of RNA degradation were measured by subtracting the RNA remaining in samples from the levels of input RNA (middle). Relative levels of partially degraded RNAs were quantified (right). Mean values are shown with SEM (n = 3). **, P < 0.01. (J) RNAs were not degraded in the solution outside of lysosomes. Isolated lysosomes were incubated with ATP for 5 min at 37°C. The lysosomes were removed by centrifugation, and the solution outside lysosomes was incubated with 5 μg of total RNA for 5 min at 37°C. Mean values are shown with SEM (n = 3). n.s., not significant. RNAs were visualized by ethidium bromide staining. (K) RNA degradation by lysed lysosomes. Isolated lysosomes were lysed in citrate-phosphate buffer (pH 5.0) containing 1% Triton X-100, mixed with 5 μg of total RNA, and incubated for 5 min at 37°C. Mean values are shown with SEM (n = 3). n.s., not significant. (L) Absence of RNA in isolated lysosomes incubated without exogenous RNA. Isolated lysosomes were incubated without exogenous RNA in the presence of ATP for 5 min at 37°C. (M) ATP requirement of RNautophagy. RNA degradation assays were performed in the absence of ATP. Total RNA levels in samples were quantified. Mean values are shown with SEM (n = 3). n.s., not significant.
Figure 3.
Figure 3.
Effect of SIDT2 overexpression on RNautophagy in the absence of LAMP2. (A) LAMP2 levels in LAMP2-deficient HeLa cells and parental HeLa cells (control HeLa) were analyzed by immunoblotting. (B and C) RNA uptake assays were performed using isolated lysosomes derived from LAMP2-deficient HeLa cells (B) or parental HeLa cells (C). Relative levels of RNA uptake were quantified. Results are expressed as mean ± SEM (n = 3). **, P < 0.01. In the absence of LAMP2, SIDT2 increased RNautophagy at similar levels to in the presence of LAMP2.
Figure 4.
Figure 4.
Effect of SIDT2 mutation on RNautophagy. (A) Neuro2a cells expressing GFP-tagged SIDT2S564A were incubated with LysoTracker Red. Fluorescence images were visualized using a confocal laser-scanning microscope. Scale bar: 10 μm. Colocalization rate was quantified (right panel, n=3). (B and D) Lysosomes were isolated from Neuro2a cells overexpressing WT or mutant SIDT2S564A or control transfectants. SIDT2 levels in lysosomes were analyzed by immunoblotting (B). The RNA uptake assay I indicated in Fig. 2A was performed (D). Relative levels of RNA uptake were quantified. Mean ± SEM (n = 3). ***, P < 0.001. (C) LAMP2C or LAMP2C-FLAG and WT or mutant SIDT2S564A were overexpressed in Neuro2a cells. Cell lysates were prepared and immunoprecipitated with an anti-FLAG antibody. Cell lysates and the resulting immunoprecipitant were analyzed by immunoblotting.
Figure 5.
Figure 5.
Effects of SIDT2 knockdown on RNA uptake and degradation by lysosomes. (A and D) Decreased levels of SIDT2 proteins in HeLa cells transfected with SIDT2-siRNA were confirmed by immunoblotting. Relative levels of SIDT2 were quantified. Results are expressed as mean ± SEM (n = 3). (B and E) RNA uptake assay I (Fig. 2A) was performed using isolated lysosomes derived from SIDT2 knockdown or control siRNA-transfected cells. Relative levels of RNA uptake were quantified. Mean ± SEM (n = 3). ***, P < 0.001. (C and F) RNA degradation assay using lysosomes isolated from SIDT2-knockdown cells or from control cells. Relative levels of RNA degradation were quantified. Mean ± SEM (n = 3). ***, P < 0.001; **, P < 0.01.
Figure 6.
Figure 6.
Effect of SIDT1 overexpression on RNautophagy. (A) Neuro2a cells expressing GFP-tagged SIDT1 were incubated with LysoTracker Red. Fluorescence images were visualized using a confocal laser-scanning microscope. Scale bar: 10 μm. Colocalization rate was quantified (right panel, n=3). (B) SIDT1 was overexpressed in Neuro2a cells. Protein levels were analyzed by immunoblotting using an anti-SIDT1 antibody. (C) Lysosomes were isolated from Neuro2a cells overexpressing SIDT1 or control transfectants. The RNA uptake assay I indicated in Fig. 2A was performed. Relative levels of RNA uptake were quantified. Mean ± SEM (n = 3). n.s., not significant.
Figure 7.
Figure 7.
Effects of Sidt2 knockdown on cellular RNA degradation. (A) Experimental paradigm for monitoring the degradation of cellular RNA. CQ, chloroquine. (B, F, H and K) Decreased levels of SIDT2 proteins in atg5 KO MEFs and in WT MEFs transfected with Sidt2-siRNA were confirmed by immunoblotting. Mean ± SEM (n = 4). ***, P < 0.001. * indicates nonspecific bands which are not decreased by Sidt2 knockdown. (C) RNA turnover in atg5 KO MEFs cells, transfected as indicated, was measured as described in (A, upper panel) and Materials and Methods. Results are expressed as mean ± SEM (n = 4). ***, P < 0.001, n.s., not significant, compared with 0 h. §§§P < 0.001, compared with time-matched control. In control and Sidt2-knockdown cells, 37.3 ± 0.6 and 21.1 ± 0.6 (mean ± SEM) % of RNA was calculated to be degraded during 24 h, respectively, and 20.9 ± 3.1 and 5.5 ± 1.3 (mean ± SEM) % during 6 h, respectively. (D) No conversion of MAP1LC3A/B-I to MAP1LC3A/B-II in atg5 KO MEFs was confirmed by immunoblotting. (E) RNA turnover in atg5 KO MEFs cells, transfected as indicated, with or without CQ was measured as described in (A, lower panel) and Materials and Methods. Mean ± SEM (n = 4). ***, P < 0.001, n.s., not significant. In control and Sidt2-knockdown cells without CQ treatment, 40.1 ± 2.0 and 26.2 ± 0.6 (mean ± SEM) % of RNA was calculated to be degraded during 24 h, respectively. In control and Sidt2-knockdown cells with CQ treatment, 24.7 ± 2.0 and 20.9 ± 0.9 (mean ± SEM) % of RNA was calculated to be degraded during 24 h, respectively. (G) RNA turnover in WT MEFs, transfected as indicated, with or without CQ were measured as described in (E). Mean ± SEM (n = 4). ***, P < 0.001, n.s., not significant. In control and Sidt2-knockdown cells without CQ treatment, 43.8 ± 2.6 and 21.8 ± 1.9 (mean ± SEM) % of RNA was calculated to be degraded during 24 h, respectively. Contribution of SIDT2 for total cellular RNA degradation was calculated to be 50.2%. In control and Sidt2-knockdown cells with CQ treatment, 23.7 ± 2.1 and 16.6 ± 1.8 (mean ± SEM) % of RNA was calculated to be degraded during 24 h, respectively. (I) RNA turnover in atg5 KO MEFs cells, transfected as indicated, was measured as described in (C). Results are expressed as mean ± SEM (n = 4). ***, P < 0.001; n.s., not significant, compared with 0 h. §§§, P < 0.001, compared with time-matched control. (J) RNA turnover in atg5 KO MEFs cells, transfected as indicated, with or without CQ was measured as described in (E). Mean ± SEM (n = 4). ***, P < 0.001, n.s., not significant. (L) RNA turnover in WT MEFs, transfected as indicated, with or without CQ were measured as described in (E). Mean ± SEM (n = 4). ***, P < 0.001; n.s., not significant. (M and N) Macroautophagic flux assay was performed as described in Materials and Methods. Mean ± SEM (n = 3). n.s., not significant. (O) WT MEFs were transfected with siRNAs as indicated, and labeled with [3H]-uridine for 24 h. Then, acid-soluble radioactivity of cells was measured as described in Materials and Methods. Mean ± SEM (n = 4). ***, P < 0.001.

References

    1. Mizushima N, Komatsu M. Autophagy: renovation of cells and tissues. Cell 2011; 147:728-41; PMID:22078875; http://dx.doi.org/ 10.1016/j.cell.2011.10.026 - DOI - PubMed
    1. Kaushik S, Cuervo AM. Methods to monitor chaperone-mediated autophagy. Methods Enzymol 2009; 452:297-324; PMID:19200890; http://dx.doi.org/ 10.1016/S0076-6879(08)03619-7 - DOI - PMC - PubMed
    1. Fujiwara Y, Furuta A, Kikuchi H, Aizawa S, Hatanaka Y, Konya C, Uchida K, Yoshimura A, Tamai Y, Wada K, et al.. Discovery of a novel type of autophagy targeting RNA. Autophagy 2013; 9:403-9; PMID:23291500; http://dx.doi.org/ 10.4161/auto.23002 - DOI - PMC - PubMed
    1. Fujiwara Y, Kikuchi H, Aizawa S, Furuta A, Hatanaka Y, Konya C, Uchida K, Wada K, Kabuta T. Direct uptake and degradation of DNA by lysosomes. Autophagy 2013; 9:1167-71; http://dx.doi.org/ 10.4161/auto.24880 - DOI - PMC - PubMed
    1. Fujiwara Y, Hase K, Wada K, Kabuta T. An RNautophagy/DNautophagy receptor, LAMP2C, possesses an arginine-rich motif that mediates RNA/DNA-binding. Biochem Biophys Res Commun 2015; 460:281-6; PMID:25772617; http://dx.doi.org/ 10.1016/j.bbrc.2015.03.025 - DOI - PubMed