

Why has under-5 mortality decreased at such different rates in different countries?
- PMID: 27046447
- PMCID: PMC4921600
- DOI: 10.1016/j.jhealeco.2016.03.002
Why has under-5 mortality decreased at such different rates in different countries?
Abstract
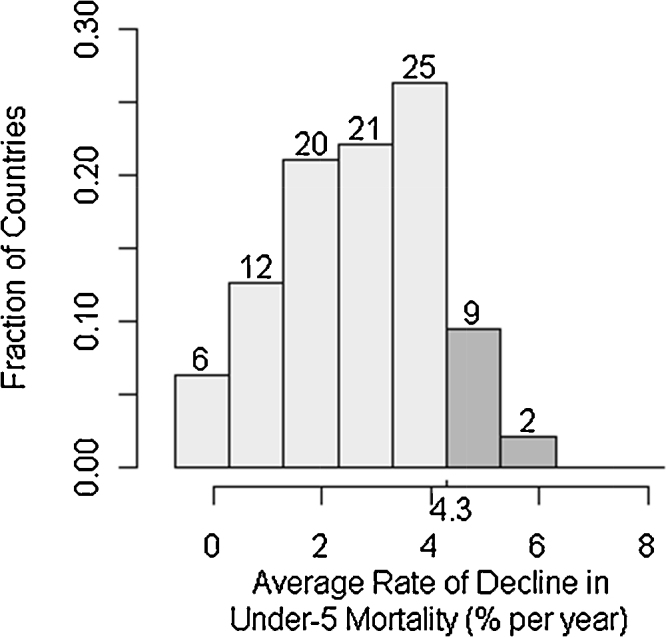
Controlling for socioeconomic and geographic factors, under-5 mortality (5q0) in developing countries has been declining at about 2.7% per year, a high rate of 'technical progress'. This paper adduces theoretical and empirical reasons for rejecting the usual specification of homogeneous technical progress across countries and uses a panel of 95 developing countries for the period 1970-2000 to explore the consequences of heterogeneity. Allowing country-specific rates of technical progress sharply reduces the estimated income elasticity of 5q0 and points to country variation in technical progress as the principal source of the (large) cross-country variation in 5q0 decline. Education levels and physician coverage also contribute and are less affected than income of allowing country variation in technical progress. The paper concludes by decomposing 1970-2000 5q0 decline into its different sources for each country.
Keywords: Hierarchical model; Technical progress; Under-5 mortality; Varying coefficients model.
Copyright © 2016 The Authors. Published by Elsevier B.V. All rights reserved.
Figures

References
-
- Adams P., Hurd M.D., McFadden D., Merrill A., Ribiero T. Healthy, wealthy and wise? Tests for direct causal paths between health and socioeconomic status. Journal of Econometrics. 2003;111(1):3–56.
-
- Banks A.S. Jerusalem; Israel: 2010. Cross-National Time-Series Data Archive. Databanks International. 〈 http://www.databanksinternational.com〉.
-
- Bates, D., Maechler, M., Dai, B., 2008. lme4: linear mixed-effects models using S4 classes. R package version 0.999375-28.
-
- Bishai D.M. Infant mortality time series are random walks with drift: are they cointegrated with economic variable? Health Economics. 1995;4:157–167. - PubMed
-
- Bloom D.E., Sachs J.D. Geography demography, and economic growth in Africa. Brookings Papers on Economic Activity. 1999;2:207–295. - PubMed
MeSH terms
LinkOut - more resources
Full Text Sources
Other Literature Sources
