. 2016 Apr 4;37(1):85-97.
doi: 10.1016/j.devcel.2016.03.001.

An FGFR1-SPRY2 Signaling Axis Limits Basal Cell Proliferation in the Steady-State Airway Epithelium

Affiliations

An FGFR1-SPRY2 Signaling Axis Limits Basal Cell Proliferation in the Steady-State Airway Epithelium

Gayan I Balasooriya et al. Dev Cell. .

Abstract

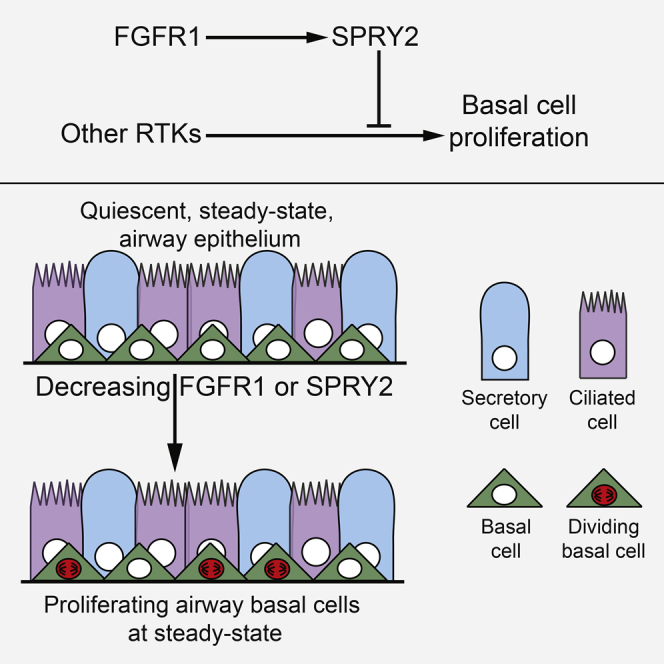
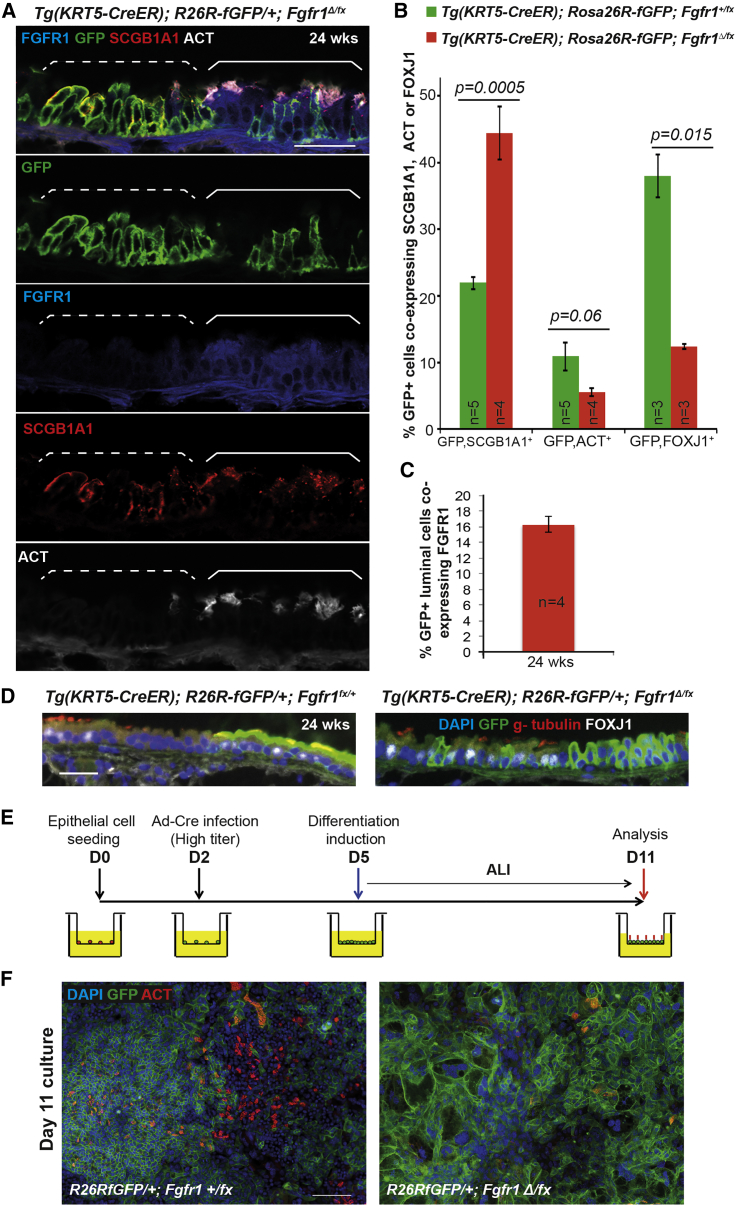
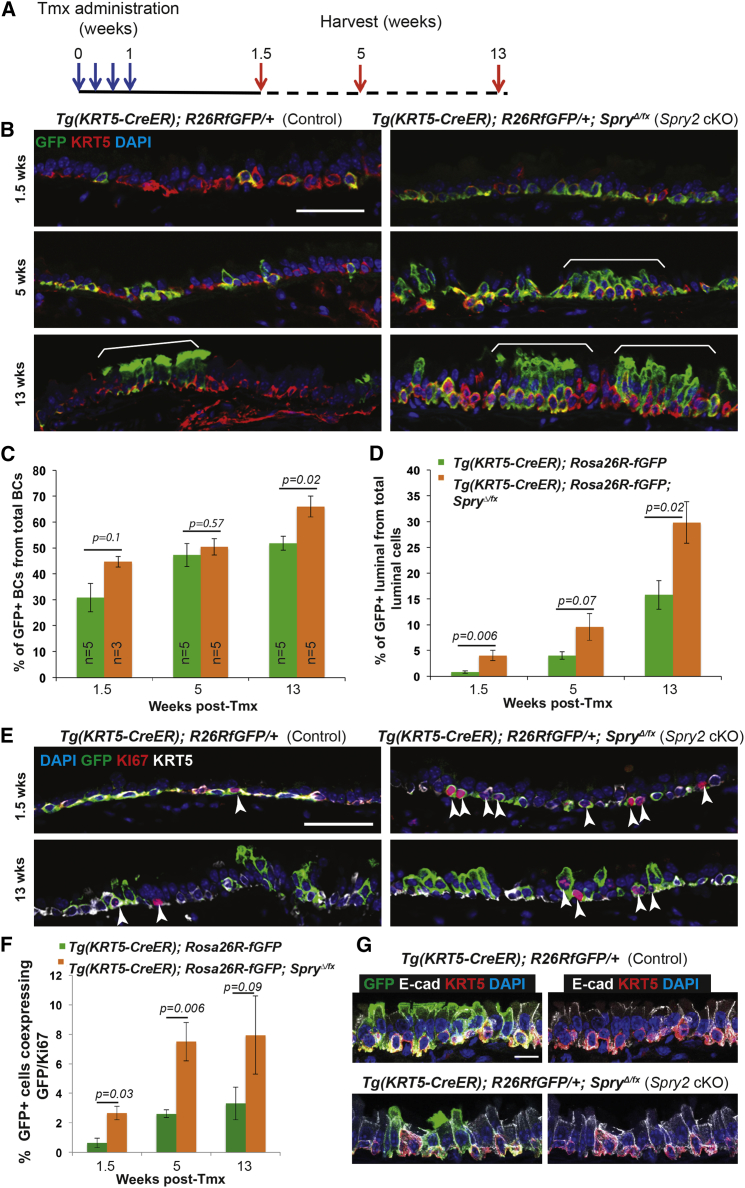
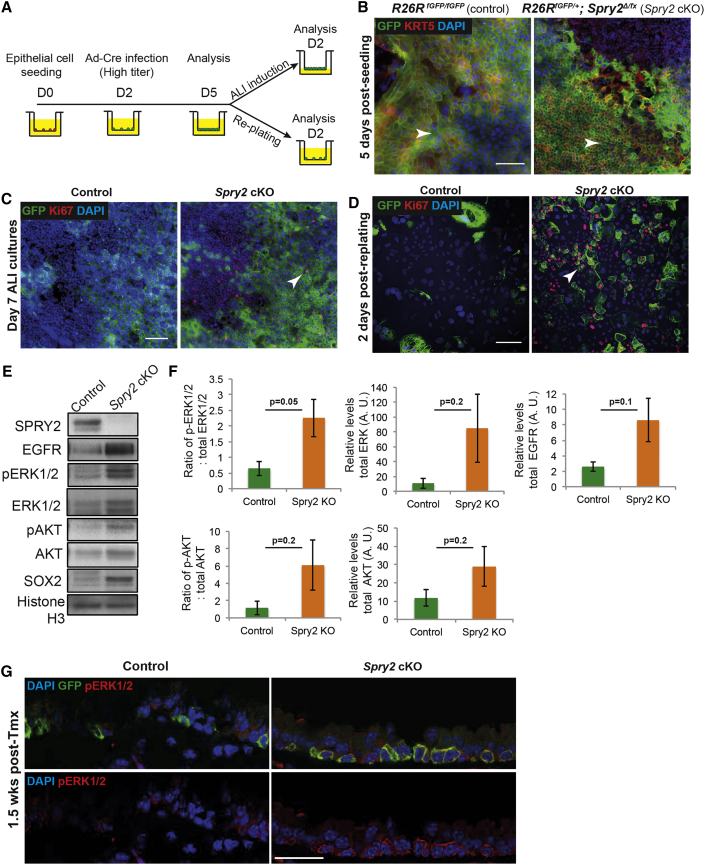
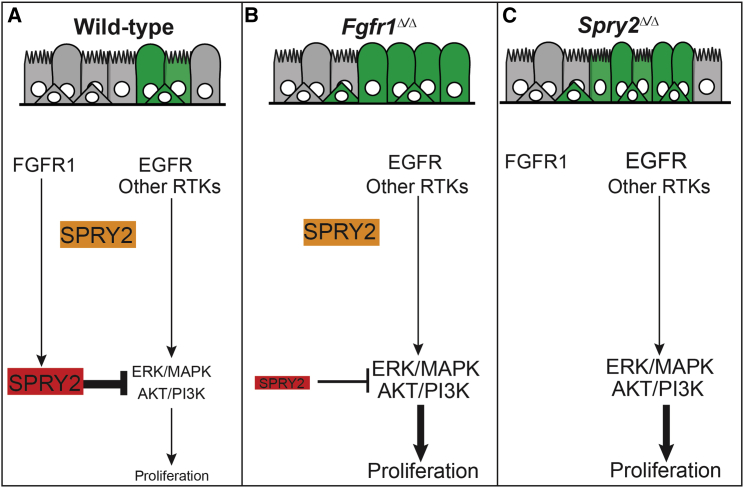
The steady-state airway epithelium has a low rate of stem cell turnover but can nevertheless mount a rapid proliferative response following injury. This suggests a mechanism to restrain proliferation at steady state. One such mechanism has been identified in skeletal muscle in which pro-proliferative FGFR1 signaling is antagonized by SPRY1 to maintain satellite cell quiescence. Surprisingly, we found that deletion of Fgfr1 or Spry2 in basal cells of the adult mouse trachea caused an increase in steady-state proliferation. We show that in airway basal cells, SPRY2 is post-translationally modified in response to FGFR1 signaling. This allows SPRY2 to inhibit intracellular signaling downstream of other receptor tyrosine kinases and restrain basal cell proliferation. An FGFR1-SPRY2 signaling axis has previously been characterized in cell lines in vitro. We now demonstrate an in vivo biological function of this interaction and thus identify an active signaling mechanism that maintains quiescence in the airway epithelium.


Figures

None
Graphical abstract
Figure 1
Figure 1
Deletion of Fgfr1 in BCs Results in Altered Tracheal Epithelial Homeostasis (A) Relative expression of Fgfr1 and Spry2 mRNA in sorted wild-type basal, secretory, and ciliated cells. (B) Schematic of Fgfr1 conditional knockout experiment. (C) Relative expression of Fgfr1 mRNA in sorted GFP+ BCs from control and Fgfr1 cKO mice 3 weeks after tmx administration. (D) Representative confocal sections from control Tg(KRT5-CreER); Rosa26RfGFP/+ and cKO Tg(KRT5-CreER); Rosa26RfGFP/+; Fgfr1Δ/fx tracheae. Green, GFP (reporter); red, KRT5 (BCs); blue, DAPI (nuclei). Increased labeling of luminal cells is visible in the Fgfr1 cKOs by 5 weeks (arrowheads), becoming large patches of labeled cells (brackets) by 13 and 24 weeks. (E) Percentage of the total T1α+ BCs that are also GFP+. (F) Percentage of total T1α luminal cells that are also GFP+. Error bars denote SEM. Scale bars, 50 μm. See also Figures S1 and S2.
Figure 2
Figure 2
Loss of FGFR1 Signaling Results in Increased Levels of BC Proliferation (A) Representative confocal sections from control Tg(KRT5-CreER); Rosa26RfGFP/+ and cKO Tg(KRT5-CreER); Rosa26RfGFP/+; Fgfr1Δ/fx tracheae at 1.5 and 13 weeks after tmx administration. Green, GFP (reporter); red, KI67 (proliferating cells); white, KRT5 (BCs); blue, DAPI (nuclei). Arrowheads indicate KI67+ cells. (B) Percentage of GFP+ cells that co-express KI67. (C) Relative expression of Ki67 mRNA in sorted GFP+ BCs from control and Fgfr1 cKO mice 3 weeks after tmx administration. (D) Schematic of in vitro experiment. (E) Low-titer Ad-Cre infection induces sporadic recombination in control Rosa26RfGFP/+ and cKO Rosa26RfGFP/+; Fgfr1Δ/fx BCs. Green, GFP (reporter); blue, DAPI (nuclei). (F) Fgfr1 deletion in vitro results in increased BC proliferation. Red, KI67 (proliferating cells); blue, DAPI (nuclei). (G) Percentage of proliferating (KI67+) cells in vitro. (H) Schematic for in vitro experiment. Wild-type (WT) BCs plated at low density (3 × 104 cells/insert) and exposed to 100 ng/ml FGF2 from day 2. (I) FGF2-treated and control wild-type BCs at day 4 after plating. Red, E-cadherin (lateral cell membrane); blue, DAPI (nuclei). (J) Number of DAPI+ cells per colony in control and FGF2-treated cells. Error bars denote SEM, Scale bars represent 50 μm in (A), (E), and (F), and 20 μm in (I). See also Figure S2.
Figure 3
Figure 3
Loss of FGFR1 Signaling in BCs Leads to an Increase in Phosphorylation of Downstream Effector Proteins and a Decrease in Levels of a SPRY2 Isoform (A) Schematic of in vitro experiment. (B) Representative western blots from control and Fgfr1 cKO day-5 BCs showing pERK1/2, total ERK1/2, pAKT, total AKT, SPRY2, and histone H3. (C) Quantification of protein in (B). (D) Model. A major function of FGFR1 in BCs is to post-translationally modify SPRY2, resulting in a SPRY2 isoform which can negatively regulate the ERK/MAPK and AKT/PI3K pathways downstream of other RTKs. (E) Confocal images of control Tg(KRT5-CreER); Rosa26RfGFP/+ and cKO Tg(KRT5-CreER); Rosa26RfGFP/+; Fgfr1Δ/fx tracheal sections at 1.5 weeks after tmx administration showing an increase in pERK1/2 levels in the Fgfr1 cKO BCs. Green, GFP (reporter); red, pERK1/2 (active ERK1/2); blue, DAPI (nuclei). Scale bar, 25 μm. (F) Schematic for exposure of wild-type BCs to FGF2. (G) Representative western blots from day-6 FGF2-stimulated and control BCs showing SPRY2, pERK1/2, total ERK1/2, pAKT, total AKT, and histone H3. (H) Quantification of protein levels in (G). Error bars denote SEM. See also Figures S3–S5.
Figure 4
Figure 4
Loss of FGFR1 Signaling Results in a Block in Ciliated Cell Differentiation (A) Confocal image of Tg(KRT5-CreER); Rosa26RfGFP/+; Fgfr1Δ/fx tracheal section. Green, GFP (reporter); blue, FGFR1; red, SCGB1A1 (secretory cells); white, acetylated tubulin (ACT, cilia). In the patch of GFP+ cells marked by the dashed bracket, FGFR1 is absent and there are no ciliated cells. In the GFP+ cells within the solid bracket, FGFR1 has not been deleted, there are fewer GFP+ cells, and ciliated cell differentiation has occurred. (B) Percentage of GFP+ cells that co-express SCGB1A1, ACT, or FOXJ1 in control Tg(KRT5-CreER); Rosa26RfGFP/+; Fgfr1+/fx and cKO Tg(KRT5-CreER); Rosa26RfGFP/+; Fgfr1Δ/fx animals 24 weeks after tmx administration. (C) Percentage of GFP+ luminal cells in cKO Tg(KRT5-CreER); Rosa26RfGFP/+; Fgfr1Δ/fx trachea that retain FGFR1 protein 24 weeks after tmx administration. (D) Sections from control and Fgfr1 cKO tracheae at 24 weeks after tmx administration. Green, GFP (reporter); red, γ-tubulin (basal bodies); white, FOXJ1 (ciliated cells). (E) Schematic of in vitro experiment. (F) Day-11 ALI cultures grown from control and Fgfr1 cKO animals. Green, GFP (reporter); red, ACT (cilia); blue, DAPI (nuclei). Error bars denote SEM. Scale bars represent 100 μm in (A) and (F), and 50 μm in (D).
Figure 5
Figure 5
Deletion of Spry2 in BCs Results in Increased Rates of Proliferation (A) Schematic of Spry2 conditional knockout experiment. (B) Representative confocal sections from control Tg(KRT5-CreER); Rosa26RfGFP/+ and cKO Tg(KRT5-CreER); Rosa26RfGFP/+; Spry2Δ/fx tracheae. Green, GFP (reporter); red, KRT5 (BCs); blue, DAPI (nuclei). Brackets indicate patches of labeled cells, more prominent in the Spry2 cKO. (C) Percentage of the total T1α+ BCs that are also GFP+. (D) Percentage of the total T1α luminal cells that are also GFP+. (E) Representative confocal sections from control and cKO tracheae at 1.5 and 13 weeks after tmx administration. Green, GFP (reporter); red, KI67 (proliferating cells); white, KRT5 (BCs); blue, DAPI (nuclei). Arrowheads indicate KI67+ cells. (F) Percentage of GFP+ cells that co-express KI67. (G) Confocal z projections from sections of control and Spry2 cKO trachea. Green, GFP (reporter); red, KRT5 (BCs); white, E-cadherin (lateral cell membranes); blue, DAPI (nuclei). Error bars denote SEM. Scale bars represent 50 μm in (B) and (E), and 10 μm in (G). See also Figure S6.
Figure 6
Figure 6
Rapidly Proliferating Spry2 Conditional Knockout BCs Have Elevated Levels of RAS-ERK and PI3K Signaling (A) Schematic of in vitro experiment. (B) Spry2 cKO (Rosa26RfGFP/+; Spry2Δ/fx) cells proliferate more rapidly than controls (Rosa26RfGFP/fGFP) in vitro and are more densely packed at culture day 5. Note that not all cKO cells are GFP+, even though SPRY2 protein is undetectable. Green, GFP (reporter); red, KRT5 (BCs); blue, DAPI (nuclei). Arrowheads indicate similar regions of the cultures. (C) Spry2 cKO cells still undergo some contact inhibition in vitro at day 7 after ALI induction. Their proliferation rate slows following induction of ALI and there are no regions of multi-layering, although KI67+ cells are still visible (arrowhead). Green, GFP (reporter); red, KI67 (proliferating cells); blue, DAPI (nuclei). (D) Spry2 cKO primary cells continue to proliferate faster in vitro following passage at day 2 after replating. Green, GFP (reporter); red, KI67 (proliferating cells, e.g. arrowhead); blue, DAPI (nuclei). (E) Representative western blots from control and Spry2 cKO day-5 BCs showing SPRY2, pAKT, total AKT, pERK1/2, total ERK1/2, SOX2, and histone H3. (F) Quantification of protein levels. Error bars denote SEM. (G) Confocal images of control Tg(KRT5-CreER); Rosa26RfGFP/+ and cKO Tg(KRT5-CreER); Rosa26RfGFP/+; SpryΔ/fx tracheal sections at 1.5 weeks after tmx administration showing an increase in pERK1/2 levels in the Spry2 cKO BCs. Green, GFP (reporter); red, pERK1/2 (active ERK1/2); blue, DAPI (nuclei). Scale bars, 25 μm. See also Figure S3.
Figure 7
Figure 7
Model of the Roles of FGFR1 and SPRY2 in Airway Basal Cells (A–C) Model for FGFR1-SPRY2 function in airway BCs. (A) In wild-type BCs, FGFR1 signaling post-translationally modifies SPRY2 resulting in an isoform of SPRY2 (red), which is able to inhibit ERK/MAPK and AKT/PI3K signaling downstream of other RTKs, such as EGFR. This FGFR1-SPRY2 signaling axis limits BC proliferation, resulting in low levels of steady-state production of new cells. (B) Following loss of FGFR1 there is a much smaller pool of ERK/AKT-inhibiting SPRY2 (red) and, hence, more active ERK/MAPK and AKT/PI3K signaling and greater levels of BC proliferation and production of new basal and luminal cells. In addition, the Fgfr1Δ/Δ cells cannot differentiate as mature multi-ciliated cells due to a role for FGFR1 signaling in luminal fate choice. (C) Similarly, following loss of all SPRY2 there is more active ERK/MAPK and AKT/PI3K signaling and greater levels of BC proliferation and, hence, production of new basal and luminal cells. Moreover, a second isoform of SPRY2 (orange), which may regulate the level of EGFR protein, is also lost. However, FGFR1 is present and ciliated cell differentiation is normal.

References

    1. Abler L.L., Mansour S.L., Sun X. Conditional gene inactivation reveals roles for Fgf10 and Fgfr2 in establishing a normal pattern of epithelial branching in the mouse lung. Dev. Dyn. 2009;238:1999–2013. - PMC - PubMed
    1. Arai D., Hegab A.E., Soejima K., Kuroda A., Ishioka K., Yasuda H., Naoki K., Kagawa S., Hamamoto J., Yin Y. Characterization of the cell of origin and propagation potential of the fibroblast growth factor 9-induced mouse model of lung adenocarcinoma. J. Pathol. 2015;235:593–605. - PMC - PubMed
    1. Blatt E.N., Yan X.H., Wuerffel M.K., Hamilos D.L., Brody S.L. Forkhead transcription factor HFH-4 expression is temporally related to ciliogenesis. Am. J. Respir. Cell Mol. Biol. 1999;21:168–176. - PubMed
    1. Brechbuhl H.M., Li B., Smith R.W., Reynolds S.D. Epidermal growth factor receptor activity is necessary for mouse basal cell proliferation. Am. J. Physiol. Lung Cell Mol. Physiol. 2014;307:L800–L810. - PMC - PubMed
    1. Chakkalakal J.V., Jones K.M., Basson M.A., Brack A.S. The aged niche disrupts muscle stem cell quiescence. Nature. 2012;490:355–360. - PMC - PubMed

Publication types

MeSH terms

Substances

LinkOut - more resources