. 2016 Mar 22:8:55.
doi: 10.3389/fnagi.2016.00055. eCollection 2016.

In Vivo Detection of Amyloid Plaques by Gadolinium-Stained MRI Can Be Used to Demonstrate the Efficacy of an Anti-amyloid Immunotherapy

Affiliations

In Vivo Detection of Amyloid Plaques by Gadolinium-Stained MRI Can Be Used to Demonstrate the Efficacy of an Anti-amyloid Immunotherapy

Mathieu D Santin et al. Front Aging Neurosci. .

Abstract

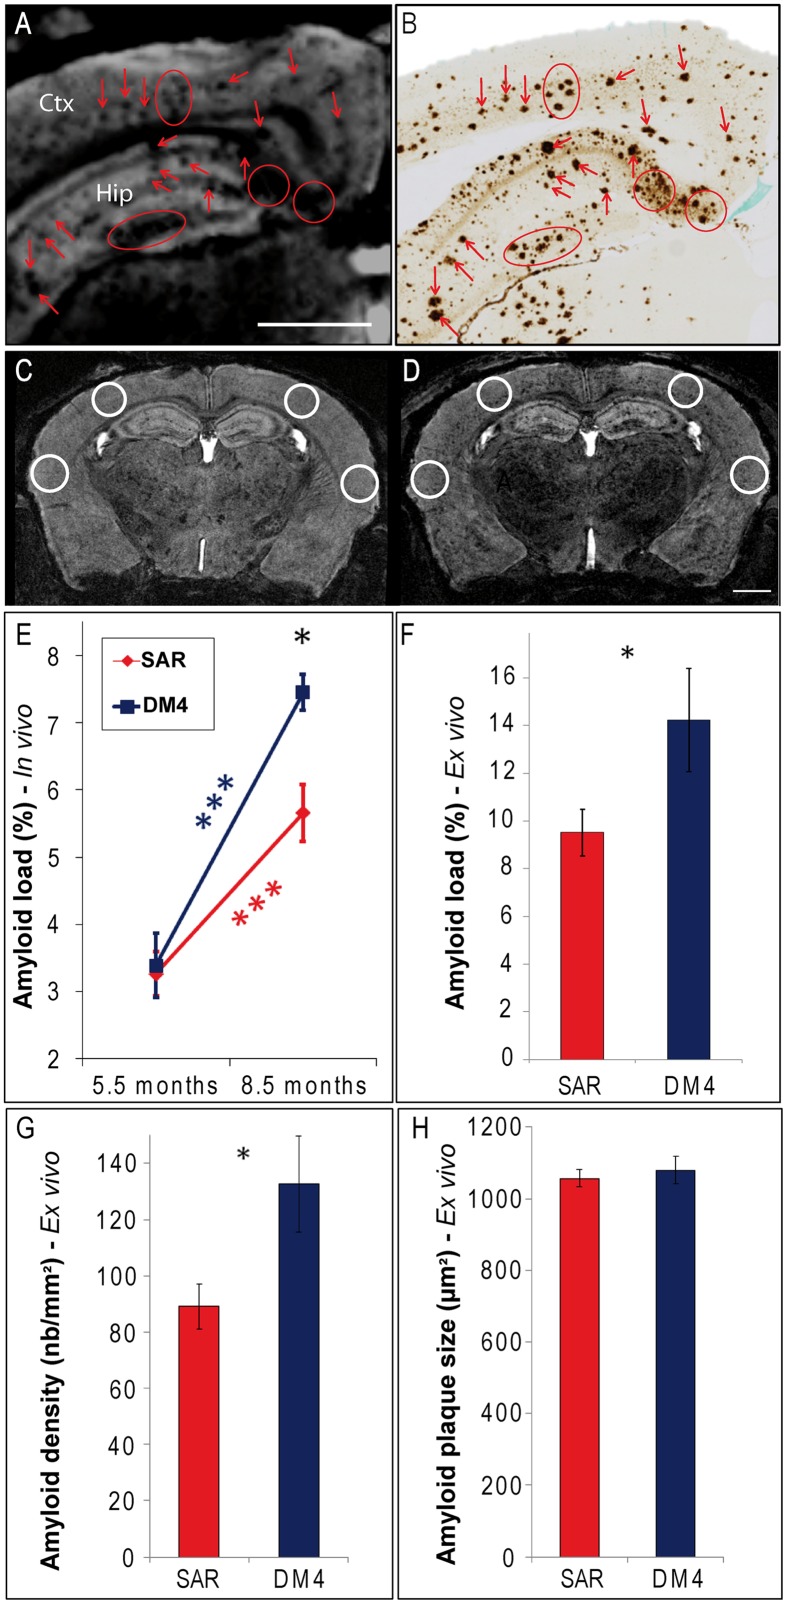
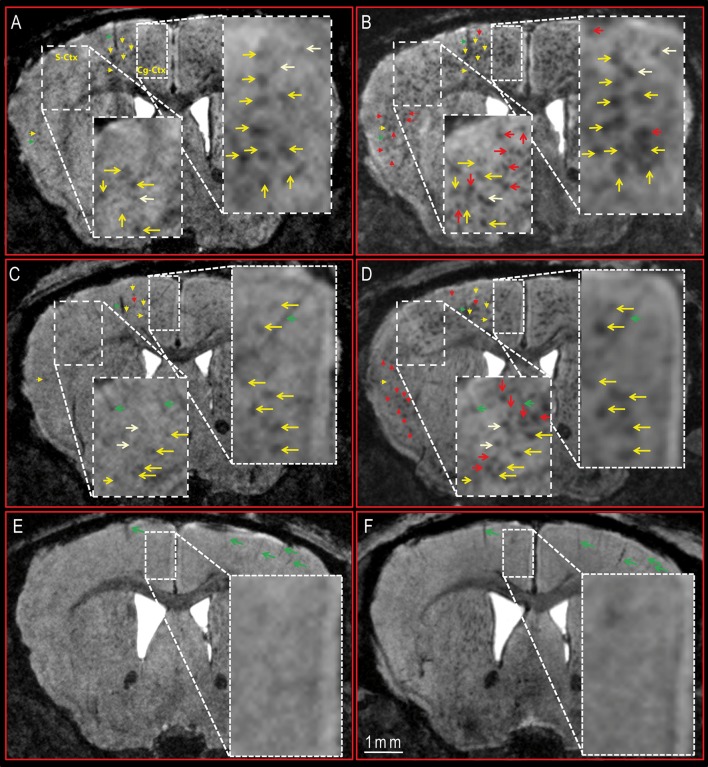
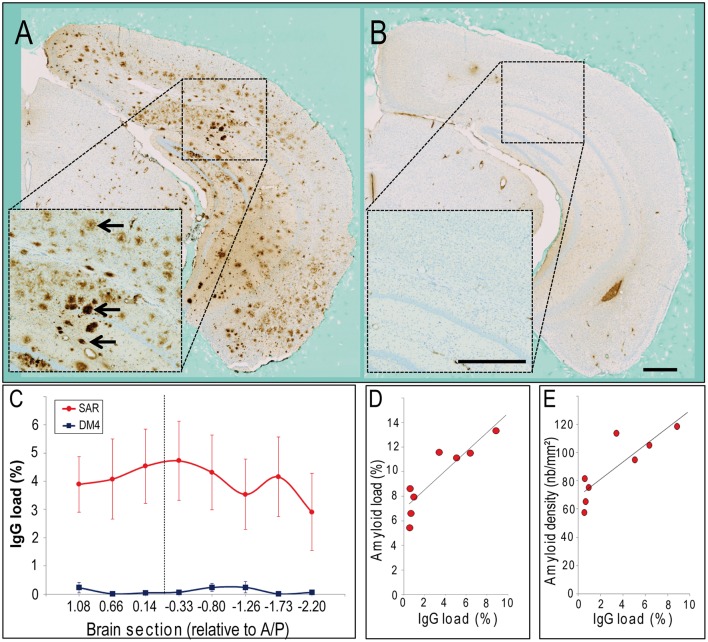
Extracellular deposition of β amyloid plaques is an early event associated to Alzheimer's disease. Here, we have used in vivo gadolinium-stained high resolution (29(∗)29(∗)117 μm(3)) magnetic resonance imaging (MRI) to follow-up in a longitudinal way individual amyloid plaques in APP/PS1 mice and evaluate the efficacy of a new immunotherapy (SAR255952) directed against protofibrillar and fibrillary forms of Aβ. APP/PS1 mice were treated for 5 months between the age of 3.5 and 8.5 months. SAR255952 reduced amyloid load in 8.5-months-old animals, but not in 5.5-months animals compared to mice treated with a control antibody (DM4). Histological evaluation confirmed the reduction of amyloid load and revealed a lower density of amyloid plaques in 8.5-months SAR255952-treated animals. The longitudinal follow-up of individual amyloid plaques by MRI revealed that plaques that were visible at 5.5 months were still visible at 8.5 months in both SAR255952 and DM4-treated mice. This suggests that the amyloid load reduction induced by SAR255952 is related to a slowing down in the formation of new plaques rather than to the clearance of already formed plaques.

Keywords: Alzheimer; MRI; amyloid; gadolinium; immunotherapy.


Figures

FIGURE 1
FIGURE 1
Modulation of amyloid load following immunotherapy with SAR255952 or DM4 monoclonal antibodies. Registration between MR images (A) and amyloid-stained histological sections (B; 6E10 immunohistochemistry) in an 8.5-months-old APP/PS1 mouse. Hypointense spots observed on the MR images at the level of the cortex (Ctx) and hippocampus (Hip; A) are localized with amyloid plaques detected on the histological sections (B). ROIs used for plaque counting displayed on MR images of an APP/PS1 mouse at the age of 5.5 (C) and 8.5 months [D; A/P level = -2.2 mm compared to the Bregma (Paxinos and Franklin, 2001)]. (E) Measures from MR sections revealed an increased amyloid load between 5.5 and 8.5 months in SAR255952 and DM4-treated animals (repeated measure ANOVA and post hoc analysis within each group F[1,11] = 23 and 29, respectively, ∗∗∗p < 0.001). At 8.5 months, the amyloid load was lower in SAR255952-treated animals (n = 9) compared to control DM4-treated mice (n = 4; repeated measure ANOVA and post hoc analysis F[1,11] = 7, p = 0.02). Histological measures confirmed the lower amyloid load [F, Student’s t-test, t(10) = 2.3, p = 0.04] and reduced density of amyloid plaques [G, t(10) = 2.7, p = 0.02] in SAR255952-treated animals at 8.5 months. The average size of the amyloid plaques was not modulated by therapy [H, t(10) = 0.6, ns]. Amyloid load in (E,F) is expressed as the proportion (%) of tissue area occupied by hypointense spots (E) or 6E10 immunoreactivity (F). Scale bars: 1 mm. Error bars represent standard error of the mean.
FIGURE 2
FIGURE 2
Longitudinal follow-up of DM4 and SAR255952 treatments by MR imaging in APP/PS1 and PS1 mice. DM4 (A,B) and SAR255952-treated (C,D) APP/PS1 mice and DM4-treated PS1 amyloid-free mice (E,F) were imaged by MRI at the age of 5.5 (A,C,E) and 8.5 months (B,D,F). Hypointense spots corresponding to amyloid plaques were visible in the APP/PS1 mice (A–D), but not in the PS1 animals (E,F). MR images from the same animals were registered to follow-up these hypointense spots between 5.5 and 8.5 months. In both DM4 (A,B) and SAR255952-treated (C,D) APP/PS1 mice the plaques detected at 5.5 months were still visible at 8.5 months (yellow arrows). Some new plaques occurred between the age of 5.5 and 8.5 months (red arrows). No plaques were detected in PS1 mice at 5.5 or 8.5 months. Typical landmarks, such as blood vessels are shown with green arrows. Some plaques that were slightly visible at 5.5 months and which were more visible at 8.5 months are labeled with pale yellow arrows. S-Ctx, somatosensory cortex; Cg-Ctx, cingulate cortex.
FIGURE 3
FIGURE 3
Evaluation of IgG staining in the brains of APP/PS1 mice treated with SAR255952 or DM4. IgG staining in the brains of APP/PS1 mice treated with SAR255952 (A) or DM4 (B). IgG was only decorating amyloid plaques (black arrows) in the SAR255952-treated animals (A). (C) IgG load in the different brain sections. The site of contrast agent administration (A/P -0.2 mm) is highlighted with a dashed line. IgG load was higher in SAR255952 compared to DM4-treated animals. The IgG load was similar within all brain sections in SAR255952 (n = 9) or DM4-treated (n = 4) animals. (D,E) Relationship between IgG and amyloid load (D, r = 0.90, p = 0.002) or density of amyloid load (E, r = 0.85, p = 0.007) quantified from histological sections. IgG and amyloid loads in (C–E) are expressed as the proportion (%) of tissue area occupied by anti-IgG or 6E10 immunoreactivity. Error bars stand for standard error of the mean. Scale bars: 500 μm.

References

    1. Adolfsson O., Pihlgren M., Toni N., Varisco Y., Buccarello A. L., Antoniello K., et al. (2012). An effector-reduced anti-beta-amyloid (Abeta) antibody with unique abeta binding properties promotes neuroprotection and glial engulfment of Abeta. J. Neurosci. 32 9677–9689. 10.1523/JNEUROSCI.4742-11.2012 - DOI - PMC - PubMed
    1. Anzalone N., Scarabino T., Venturi C., Cristaudo C., Tartaro A., Scotti G., et al. (2013). Cerebral neoplastic enhancing lesions: multicenter, randomized, crossover intraindividual comparison between gadobutrol (1.0M) and gadoterate meglumine (0.5M) at 0.1 mmol Gd/kg body weight in a clinical setting. Eur. J. Radiol. 82 139–145. 10.1016/j.ejrad.2011.07.005 - DOI - PubMed
    1. Blanchard V., Moussaoui S., Czech C., Touchet N., Bonici B., Planche M., et al. (2003). Time sequence of maturation of dystrophic neurites associated with Ab deposits in APP/PS1 transgenic mice. Exp. Neurol. 184 247–263. 10.1016/S0014-4886(03)00252-8 - DOI - PubMed
    1. Braak H., Del Tredici K. (2015). The preclinical phase of the pathological process underlying sporadic Alzheimer’s disease. Brain 138 2814–2833. 10.1093/brain/awv236 - DOI - PubMed
    1. Burgold S., Filser S., Dorostkar M. M., Schmidt B., Herms J. (2014). In vivo imaging reveals sigmoidal growth kinetic of beta-amyloid plaques. Acta Neuropathol. Commun. 2 30 10.1186/2051-5960-2-30 - DOI - PMC - PubMed