

Genotoxicity of Cytolethal Distending Toxin (CDT) on Isogenic Human Colorectal Cell Lines: Potential Promoting Effects for Colorectal Carcinogenesis
- PMID: 27047802
- PMCID: PMC4803749
- DOI: 10.3389/fcimb.2016.00034
Genotoxicity of Cytolethal Distending Toxin (CDT) on Isogenic Human Colorectal Cell Lines: Potential Promoting Effects for Colorectal Carcinogenesis
Abstract
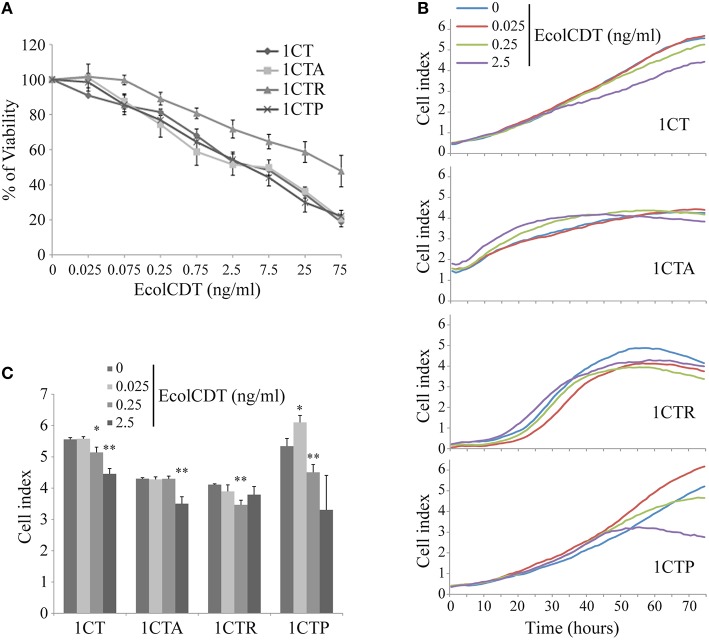
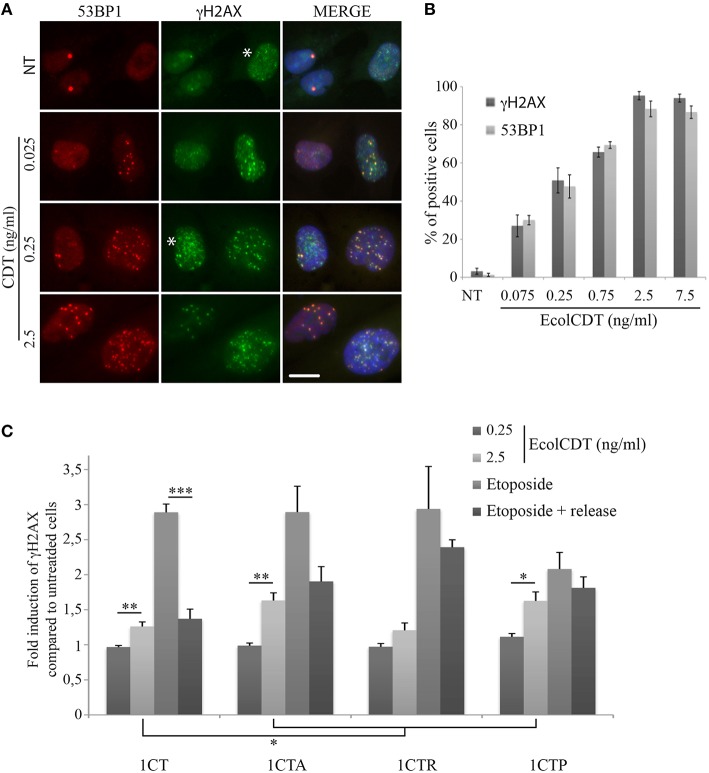
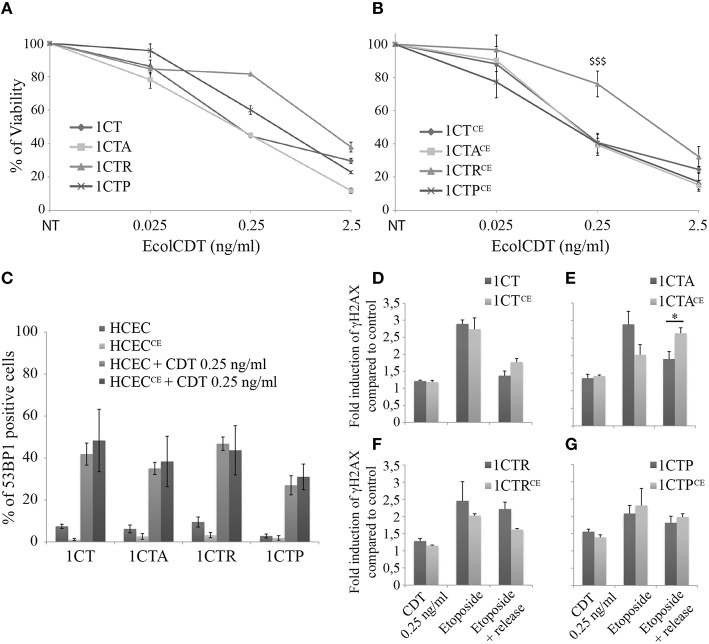
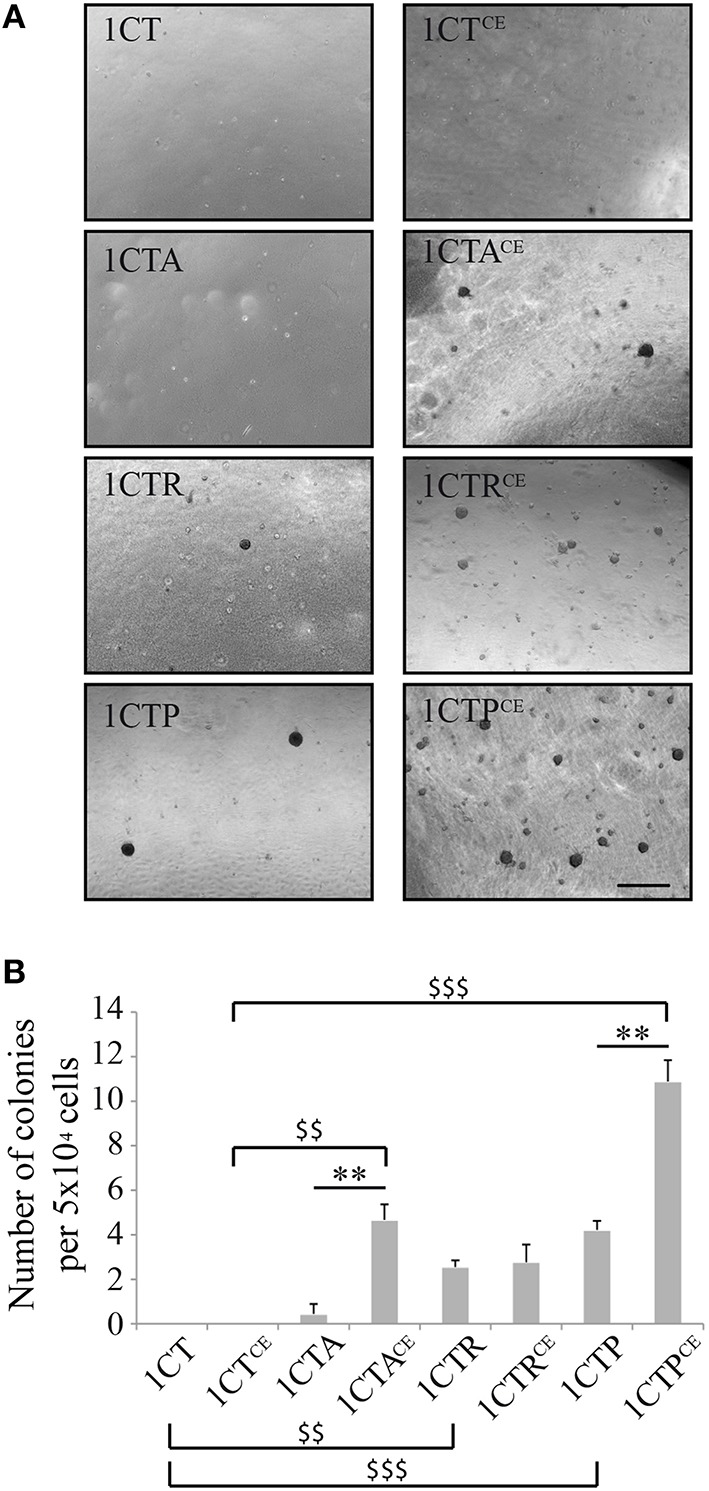
The composition of the human microbiota influences tumorigenesis, notably in colorectal cancer (CRC). Pathogenic Escherichia coli possesses a variety of virulent factors, among them the Cytolethal Distending Toxin (CDT). CDT displays dual DNase and phosphatase activities and induces DNA double strand breaks, cell cycle arrest and apoptosis in a broad range of mammalian cells. As CDT could promote malignant transformation, we investigated the cellular outcomes induced by acute and chronic exposures to E. coli CDT in normal human colon epithelial cells (HCECs). Moreover, we conducted a comparative study between isogenic derivatives cell lines of the normal HCECs in order to mimic the mutation of three major genes found in CRC genetic models: APC, KRAS, and TP53. Our results demonstrate that APC and p53 deficient cells showed impaired DNA damage response after CDT exposure, whereas HCECs expressing oncogenic KRAS (V12) were more resistant to CDT. Compared to normal HCECs, the precancerous derivatives exhibit hallmarks of malignant transformation after a chronic exposure to CDT. HCECs defective in APC and p53 showed enhanced anchorage independent growth and genetic instability, assessed by the micronucleus formation assay. In contrast, the ability to grow independently of anchorage was not impacted by CDT chronic exposure in KRAS(V12) HCECs, but micronucleus formation is dramatically increased. Thus, CDT does not initiate CRC by itself, but may have promoting effects in premalignant HCECs, involving different mechanisms in function of the genetic alterations associated to CRC.
Keywords: APC; DNA double strand breaks; KRAS; colorectal cancer; cytolethal distending toxin; genotoxicity; p53.
Figures


Similar articles
-
AKT2 suppresses pro-survival autophagy triggered by DNA double-strand breaks in colorectal cancer cells.Cell Death Dis. 2017 Aug 24;8(8):e3019. doi: 10.1038/cddis.2017.418. Cell Death Dis. 2017. PMID: 28837154 Free PMC article.
-
Autophagy of Intestinal Epithelial Cells Inhibits Colorectal Carcinogenesis Induced by Colibactin-Producing Escherichia coli in ApcMin/+ Mice.Gastroenterology. 2020 Apr;158(5):1373-1388. doi: 10.1053/j.gastro.2019.12.026. Epub 2020 Jan 7. Gastroenterology. 2020. PMID: 31917256
-
From single-strand breaks to double-strand breaks during S-phase: a new mode of action of the Escherichia coli Cytolethal Distending Toxin.Cell Microbiol. 2013 Jan;15(1):1-15. doi: 10.1111/cmi.12028. Epub 2012 Oct 9. Cell Microbiol. 2013. PMID: 22978660
-
Cytolethal distending toxin: a conserved bacterial genotoxin that blocks cell cycle progression, leading to apoptosis of a broad range of mammalian cell lineages.Microbiology (Reading). 2011 Jul;157(Pt 7):1851-1875. doi: 10.1099/mic.0.049536-0. Epub 2011 May 12. Microbiology (Reading). 2011. PMID: 21565933 Free PMC article. Review.
-
K-ras Mutations as the Earliest Driving Force in a Subset of Colorectal Carcinomas.In Vivo. 2017 Jul-Aug;31(4):527-542. doi: 10.21873/invivo.11091. In Vivo. 2017. PMID: 28652417 Free PMC article. Review.
Cited by
-
The Four Horsemen in Colon Cancer.J Oncol. 2019 Sep 29;2019:5636272. doi: 10.1155/2019/5636272. eCollection 2019. J Oncol. 2019. PMID: 31662752 Free PMC article. Review.
-
Bacterial Genotoxin-Induced DNA Damage and Modulation of the Host Immune Microenvironment.Toxins (Basel). 2020 Jan 21;12(2):63. doi: 10.3390/toxins12020063. Toxins (Basel). 2020. PMID: 31973033 Free PMC article. Review.
-
The Gum-Gut Axis: Periodontitis and the Risk of Gastrointestinal Cancers.Cancers (Basel). 2023 Sep 15;15(18):4594. doi: 10.3390/cancers15184594. Cancers (Basel). 2023. PMID: 37760563 Free PMC article. Review.
-
Oral and intestinal bacterial exotoxins: Potential linked to carcinogenesis.Prog Mol Biol Transl Sci. 2020;171:131-193. doi: 10.1016/bs.pmbts.2020.02.004. Epub 2020 Apr 9. Prog Mol Biol Transl Sci. 2020. PMID: 32475520 Free PMC article. Review.
-
From Microbiome to Malignancy: Unveiling the Gut Microbiome Dynamics in Pancreatic Carcinogenesis.Int J Mol Sci. 2025 Mar 28;26(7):3112. doi: 10.3390/ijms26073112. Int J Mol Sci. 2025. PMID: 40243755 Free PMC article. Review.
References
Publication types
MeSH terms
Substances
LinkOut - more resources
Full Text Sources
Other Literature Sources
Medical
Research Materials
Miscellaneous