. 2016 Apr 5:14:26.
doi: 10.1186/s12915-016-0247-4.

Quaternary structure of a G-protein-coupled receptor heterotetramer in complex with Gi and Gs

Affiliations

Quaternary structure of a G-protein-coupled receptor heterotetramer in complex with Gi and Gs

Gemma Navarro et al. BMC Biol. .

Abstract

Background: G-protein-coupled receptors (GPCRs), in the form of monomers or homodimers that bind heterotrimeric G proteins, are fundamental in the transfer of extracellular stimuli to intracellular signaling pathways. Different GPCRs may also interact to form heteromers that are novel signaling units. Despite the exponential growth in the number of solved GPCR crystal structures, the structural properties of heteromers remain unknown.

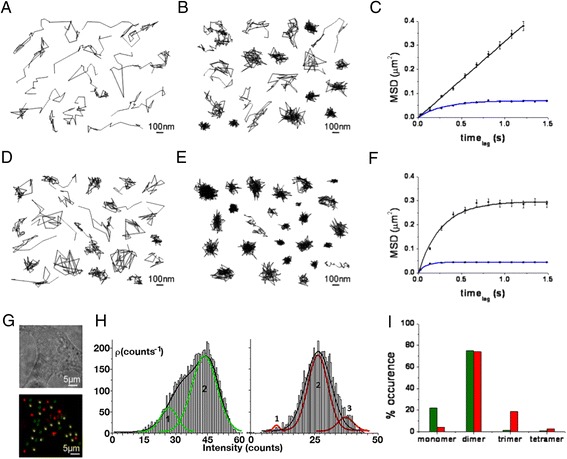
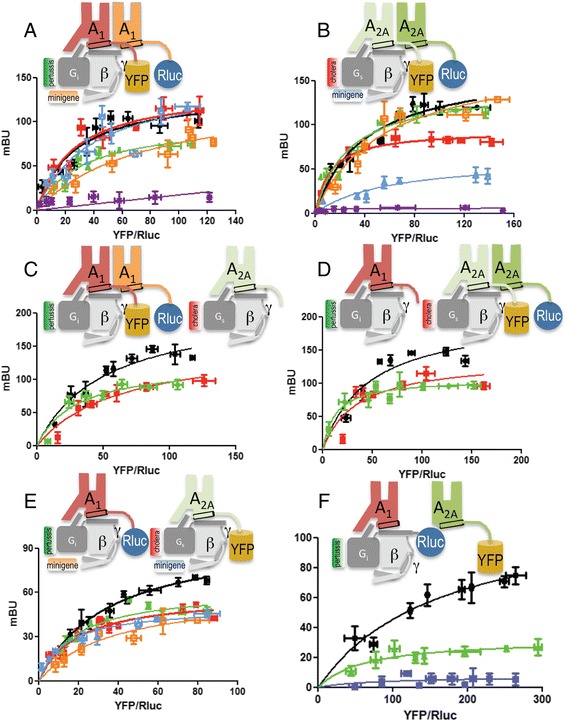
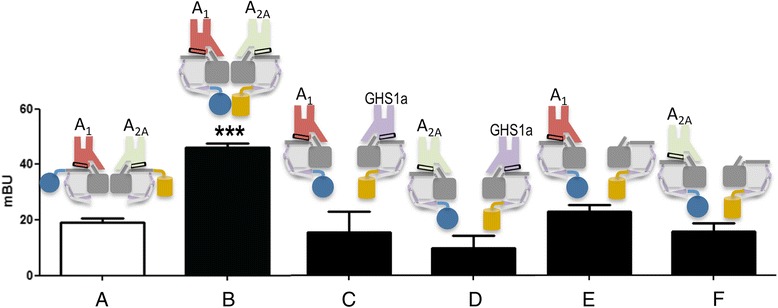
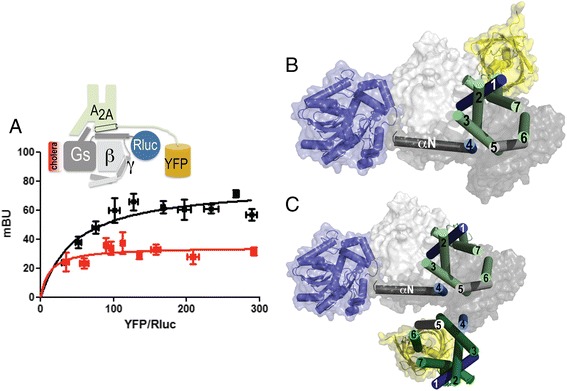
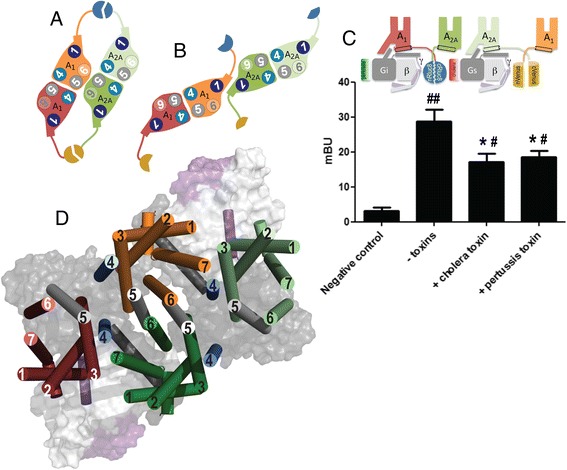
Results: We used single-particle tracking experiments in cells expressing functional adenosine A1-A2A receptors fused to fluorescent proteins to show the loss of Brownian movement of the A1 receptor in the presence of the A2A receptor, and a preponderance of cell surface 2:2 receptor heteromers (dimer of dimers). Using computer modeling, aided by bioluminescence resonance energy transfer assays to monitor receptor homomerization and heteromerization and G-protein coupling, we predict the interacting interfaces and propose a quaternary structure of the GPCR tetramer in complex with two G proteins.

Conclusions: The combination of results points to a molecular architecture formed by a rhombus-shaped heterotetramer, which is bound to two different interacting heterotrimeric G proteins (Gi and Gs). These novel results constitute an important advance in understanding the molecular intricacies involved in GPCR function.

Keywords: BRET; GPCR; Heterotetramer; Heterotrimeric G protein; Molecular modeling; Single-particle tracking.


Figures

Fig. 1
Fig. 1
Cell surface mobility of A1R-GFP and A2AR-mCherry. Individual trajectories of particles containing GFP fused to the C-terminus of A1R (A1-GFP) (a and b) or mCherry fused to the C-terminus of A2AR (A2A-mCherry) (d and e) on HEK-293T cells expressing A1-GFP (a), A2A-mCherry (d) or both (b and e). The trajectory and the fluorescence intensity of the individual particles were recorded over time using total internal reflection microscopy (TIRFM) and an electron multiplying charged-coupled device (EMCCD) camera recording. Receptor motion was determined by plotting (versus time lag) the mean square displacement (MSD) of A1-GFP (c) in the absence (black line) or presence of A2A-mCherry (blue line), or A2A-mCherry (f) in the presence (black line) or presence of A1-GFP (blue line). Data sets were fitted to mathematical models of free and confined diffusion for A1R and A2AR respectively. g Co-localization of A1-GFP and A2A-mCherry is observed (yellow dots). Scale bar: 100 nm. h Distribution of the fluorescence signal of A1-GFP (left) and A2A-mCherry (right) within co-localized receptors (yellow dots in g). Curves approximately delineate the number of monomers, dimers, or trimers within the co-localized complex. i Stoichiometry analysis performed for co-localized A1-GFP and A2A-mCherry receptor particles co-expressed in HEK-293T cells (yellow dots in g). Green corresponds to A1-GFP and red to A2A-mCherry
Fig. 2
Fig. 2
Influence of G proteins on A1R and A2AR homodimerization and heterodimerization. B Bioluminescence resonance energy transfer (BRET) saturation curves were performed in HEK-293T cells 48 h post-transfection with (a, c) 0.3 μg of cDNA corresponding to A1R-Rluc and increasing amounts of A1R-YFP (0.1–1.5 μg cDNA) or GHS1a-YFP (0.25–2 μg cDNA) as negative control (a, purple line), without (a) or with (c) 0.15 μg of cDNA corresponding to A2AR; (b, d) 0.2 μg of cDNA corresponding to A2AR-Rluc and increasing amounts of A2AR-YFP (0.1–1.0 μg cDNA) or GHS1a-YFP (0.25–2 μg cDNA) as negative control (b, purple line), without (b) or with (d) 0.5 μg of cDNA corresponding to A1R; (e) 0.3 μg of cDNA corresponding to A1R-Rluc and increasing amounts of A2AR-YFP (0.1–1.0 μg cDNA); and (f) 0.5 μg of cDNA corresponding to A1R (except control blue curves that were obtained in cells not expressing A1R), 2 μg of cDNA corresponding to Gi-Rluc, and increasing amounts of A2AR-YFP (0.1–0.5 μg cDNA). In panels a, b, and e, cells were also transfected with 0.5 μg of cDNA corresponding to the Gi-related (orange curves) or Gs-related (blue curves) minigenes. Cells were treated for 16 h with medium (black curves), with 10 ng/ml of pertussis toxin (green curves), or with 100 ng/ml of cholera toxin (red curves) prior to BRET determination. To confirm similar donor expressions (approximately 100,000 bioluminescence units) while monitoring the increase in acceptor expression (1000–40,000 fluorescence units), the fluorescence and luminescence of each sample were measured before energy transfer data acquisition. MiliBRET unit (mBU) values are the mean ± standard error of the mean of four to six different experiments grouped as a function of the amount of BRET acceptor. In each panel (top) a cartoon depicts the proteins to which Rluc and YFP were fused and the presence or not of partner receptors and/or Gs or Gi proteins [schemes in c to f are not intended to illustrate on stoichiometry because the predominant form in cells expressing the two receptors was the heterotetramer containing two A1 and two A2A receptors (see “Results”)]
Fig. 3
Fig. 3
Gs and Gi coupling to adenosine A1R-A2AR heterocomplexes. Bioluminescence resonance energy transfer (BRET) experiments were performed in HEK-293T cells 48 h post-transfection with (a, b) 0.2 μg of cDNA corresponding to A1R and 0.15 μg of cDNA corresponding to A2AR; (c, d) 0.2 μg of cDNA corresponding to A1R or 0.15 μg of cDNA corresponding to A2AR and 0.4 μg of cDNA corresponding to growth hormone secretagogue receptor GHS1a; (e) 0.2 μg of cDNA corresponding to A1R; or (f) 0.15 μg of cDNA corresponding to A2AR. Cells were also transfected with 2 μg of cDNA corresponding to the α-subunit of Gi fused to Rluc and increasing amounts of cDNA corresponding to the α-subunit of Gs fused to YFP (a) or 0.3 μg of cDNA corresponding to the γ-subunit fused to Rluc and increasing amounts of cDNA corresponding to the γ-subunit fused to YFP (b–f). Maximum miliBRET unit (mBU) values are the mean ± standard error of the mean of four different experiments. A scheme showing the protein to which Rluc and YFP were fused is provided (top). ***p < 0.001 by one-way ANOVA with post - hoc Dunnett’s test
Fig. 4
Fig. 4
Orientation of a G protein in a receptor homodimer. Bioluminescence resonance energy transfer (BRET) saturation experiments were performed in HEK-293T cells transfected with 2 μg of cDNA corresponding to the α-subunit of Gs fused to Rluc and increasing amounts of A2AR-YFP (0.1–0.5 μg) cDNA. a BRET measurements in cells pretreated for 16 h with medium (black line) or with 100 ng/ml of cholera toxin (red line). Both fluorescence and luminescence of each sample were measured before every experiment to confirm similar donor expressions (approximately 50,000 bioluminescence units) while monitoring the increase in acceptor expression (1000–10,000 fluorescence units). miliBRET unit (mBU) values are the mean ± standard error of the mean of four to five different experiments grouped as a function of the amount of BRET acceptor. A scheme of the placement of donor and acceptor BRET moieties is provided (top). b Molecular model of the A2AR-Gs complex. Rluc (blue) is attached to the N-terminal αN helix of Gs (gray), and YFP (yellow) is attached to the C-terminal domain of A2AR (light green) (see Additional file 9: Figure S9 for details). c Arrangement of A2AR homodimers modeled via the TM4/5 interface as observed in the oligomeric structure of β1-AR [4]. The A2AR protomer bound to αs is shown in light green, whereas the second A2AR-YFP protomer is shown in dark green. The molecular model in panel c (BRET between Rluc in Gs α subunit and YFP in a second A2AR protomer; center-to-center distance between Rluc and YFP of 6.5 nm), in contrast to the model shown in panel B (BRET between Rluc in Gs α subunit and YFP in the G-protein bound A2AR protomer; center-to-center distance between Rluc and YFP of 8.3 nm), would favor the observed high-energy transfer (see panel a) between αs-Rluc and A2AR-YFP
Fig. 5.
Fig. 5.
Bioluminescence resonance energy transfer (BRET)-aided construction of a model consisting of Gi and Gs bound to an A1R-A2AR heterotetramer. a, b A1R-A2AR tetramer built using TM5/6 (a) or TM1 (b) inter-receptor interfaces modeled as in the structure of the μ opioid receptor [3]. TM helices 1, 4, and 5, involved in receptor dimerization, are highlighted in dark blue, light blue, and gray, respectively. nRluc8 and cRluc8 are shown in blue and nVenus and cVenus in dark yellow. c BRET and bimolecular fluorescence complementation experiments were performed in HEK-293T cells transfected with 1.5 μg of cDNA corresponding to A1R-cRluc8 and A2AR-nRluc8, and 1.5 μg of cDNA corresponding to A1R-nVenus and A2AR-cVenus. As the negative control, cells were transfected with 1 μg of cDNA corresponding to nRluc8 and 1.5 μg of cDNA corresponding to A2AR-nRluc8, A1R-nVenus, and A2AR-cVenus. Cells were treated for 16 h with medium (– toxins), 10 ng/ml of pertussis toxin (+ pertussis), or 100 ng/ml of cholera toxin (+ cholera) prior to BRET determination. The relative amount of BRET is given as in Fig. 4 and values are the mean ± standard error of the mean of three different experiments. Student’s t-test showed statistically significant differences with respect to the control (# p < 0.05, ## p < 0.01) and a significant effect in the presence of either toxin over BRET in the absence of toxins (*p < 0.05). A schematic representation at the top shows the protein to which the hemi luminescent or fluorescent proteins were fused. d Molecular model of the A1R-A2AR tetramer in complex with Gi and Gs. A1R bound to Gi is shown in red, Gi-unbound A1R is shown in orange, A2AR bound to Gs is shown in dark green, Gs-unbound A2AR is shown in light green, and the α, β-, and γ-subunits of Gi and Gs are shown in dark gray, light gray, and purple, respectively. Transmembrane helices 4 and 5 are highlighted in light blue and gray, respectively

References

    1. Fung JJ, Deupi X, Pardo L, Yao XJ, Velez-Ruiz GA, Devree BT, et al. Ligand-regulated oligomerization of beta(2)-adrenoceptors in a model lipid bilayer. EMBO J. 2009;28:2384–2392. doi: 10.1038/emboj.2009.267. - DOI - PMC - PubMed
    1. Albizu L, Cottet M, Kralikova M, Stoev S, Seyer R, Brabet I, et al. Time-resolved FRET between GPCR ligands reveals oligomers in native tissues. Nat Chem Biol. 2010;6:587–594. doi: 10.1038/nchembio.396. - DOI - PMC - PubMed
    1. Manglik A, Kruse AC, Kobilka TS, Thian FS, Mathiesen JM, Sunahara RK, et al. Crystal structure of the micro-opioid receptor bound to a morphinan antagonist. Nature. 2012;485:321–326. doi: 10.1038/nature10954. - DOI - PMC - PubMed
    1. Huang J, Chen S, Zhang JJ, Huang XY. Crystal structure of oligomeric β1-adrenergic G protein-coupled receptors in ligand-free basal state. Nat Struct Mol Biol. 2013;20:419–425. doi: 10.1038/nsmb.2504. - DOI - PMC - PubMed
    1. Lane JR, Donthamsetti P, Shonberg J, Draper-Joyce CJ, Dentry S, Michino M, et al. A new mechanism of allostery in a G protein-coupled receptor dimer. Nat Chem Biol. 2014;10:745–752. doi: 10.1038/nchembio.1593. - DOI - PMC - PubMed

Publication types

MeSH terms

Substances