

RNA Sequencing Quantification of Xenobiotic-Processing Genes in Various Sections of the Intestine in Comparison to the Liver of Male Mice
- PMID: 27048750
- PMCID: PMC4885488
- DOI: 10.1124/dmd.115.068270
RNA Sequencing Quantification of Xenobiotic-Processing Genes in Various Sections of the Intestine in Comparison to the Liver of Male Mice
Abstract
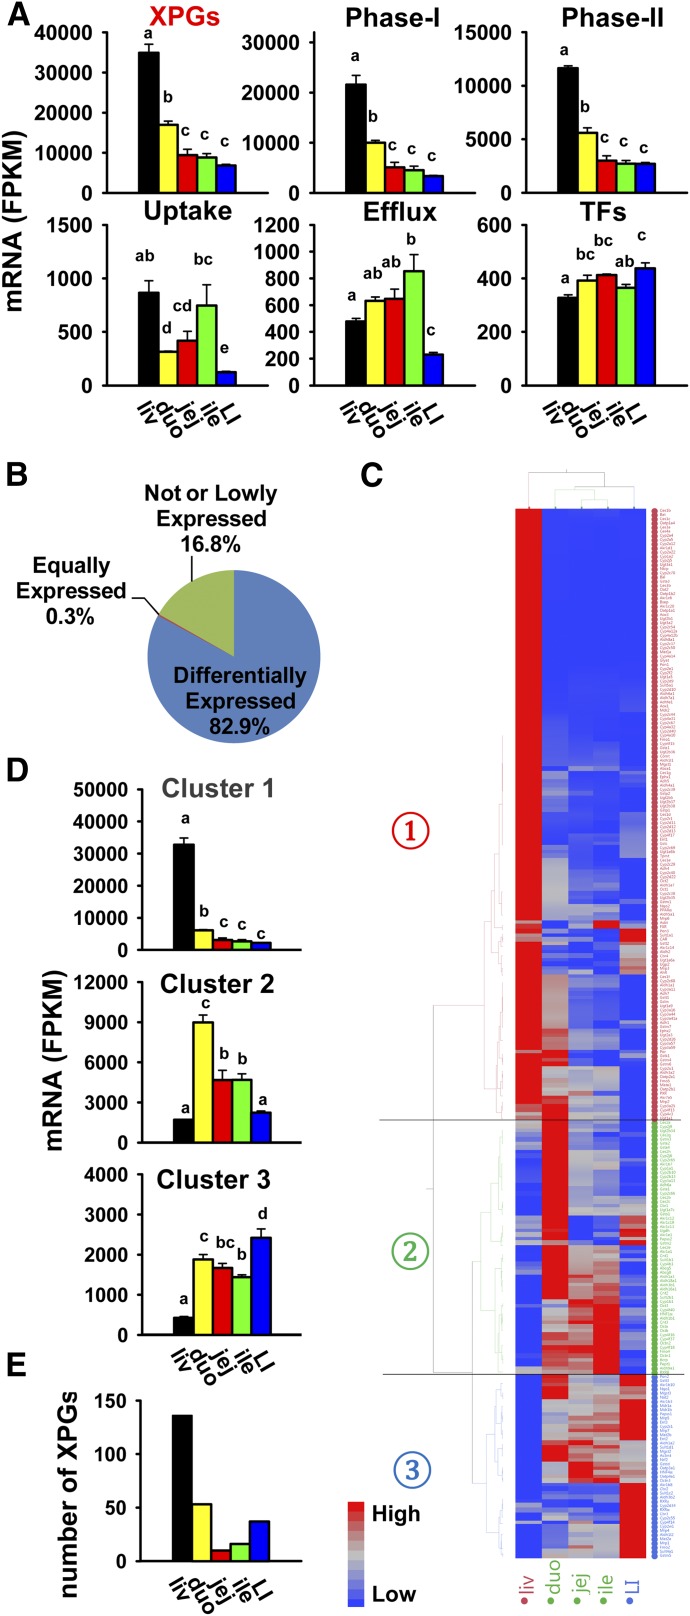
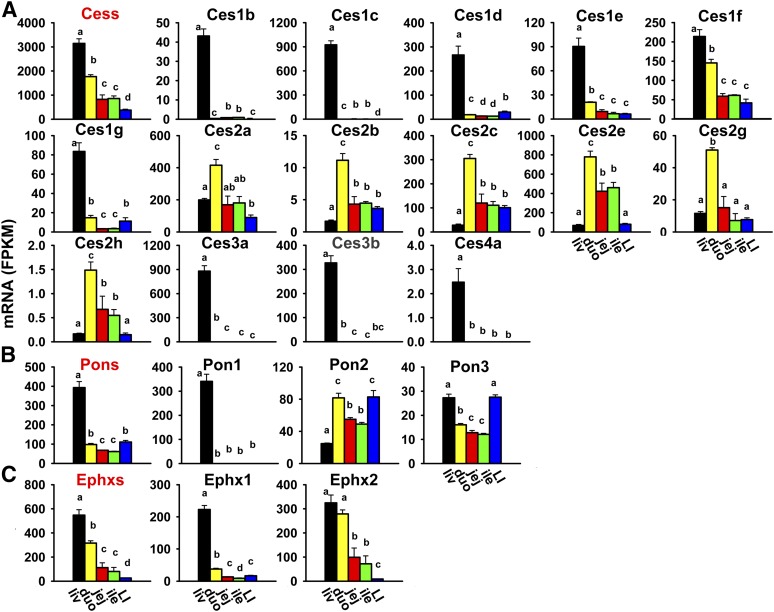
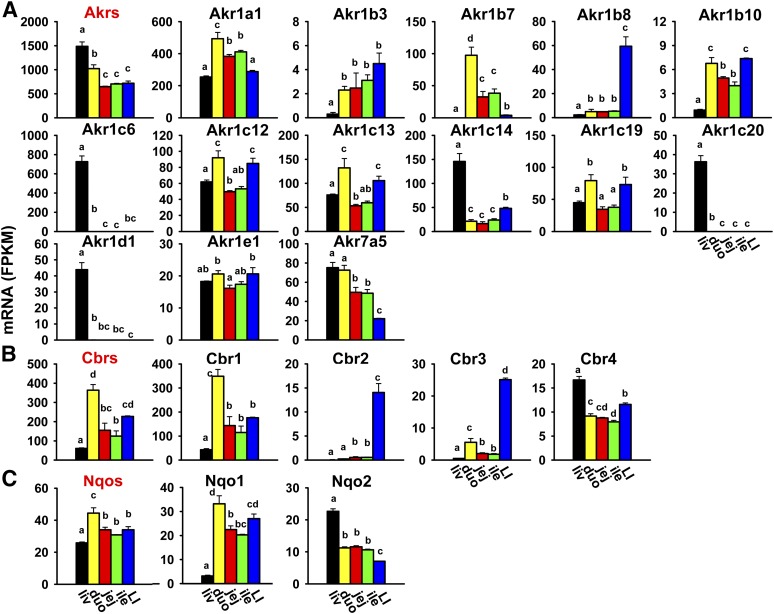
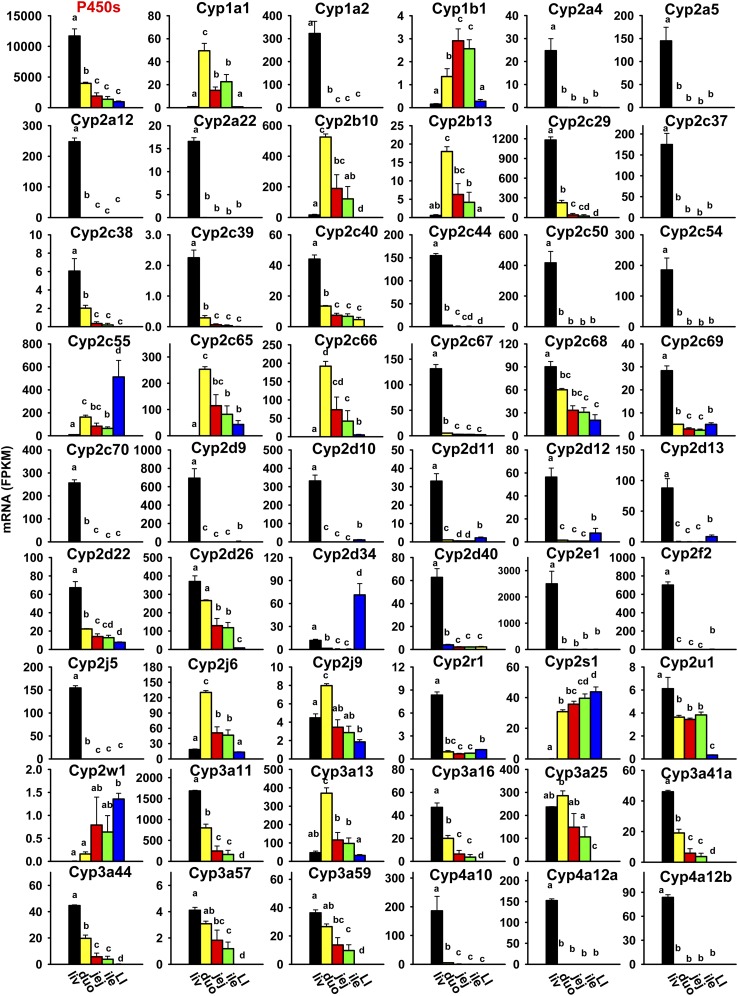
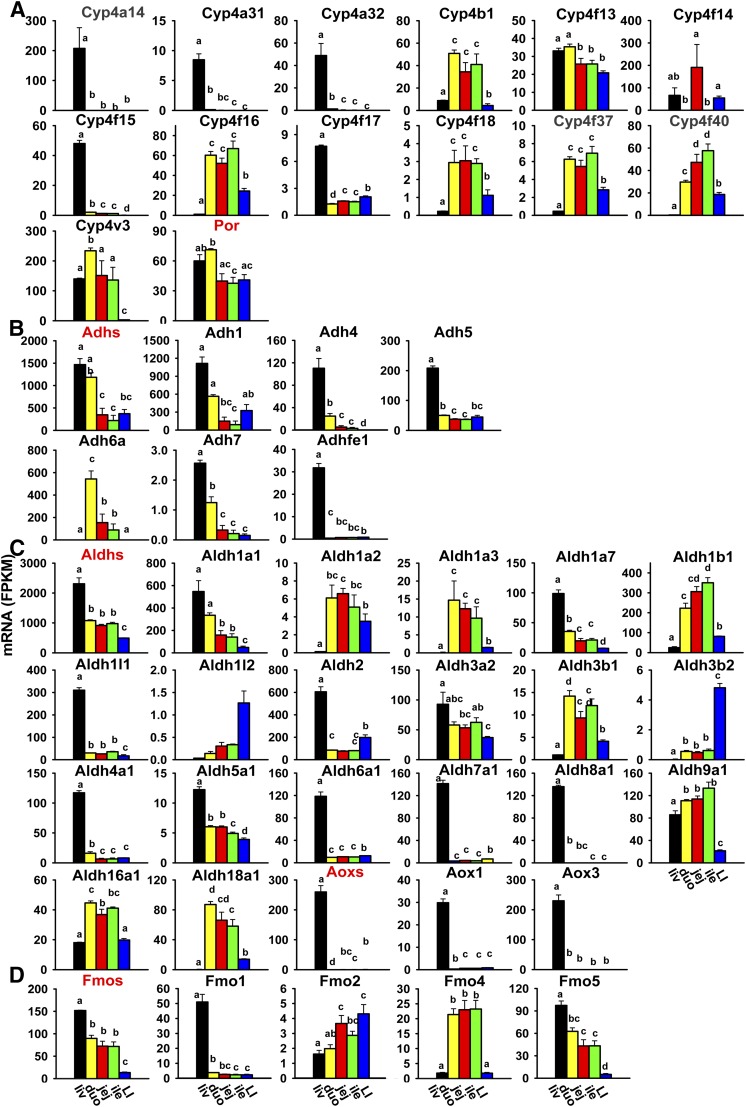
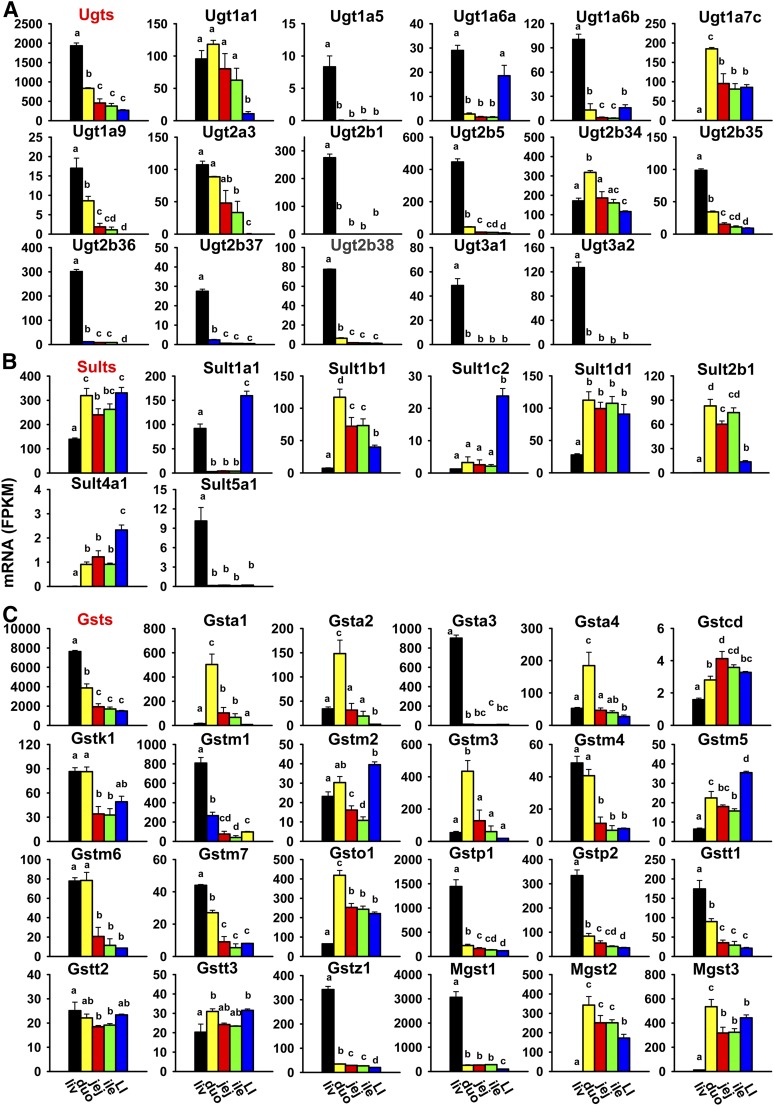
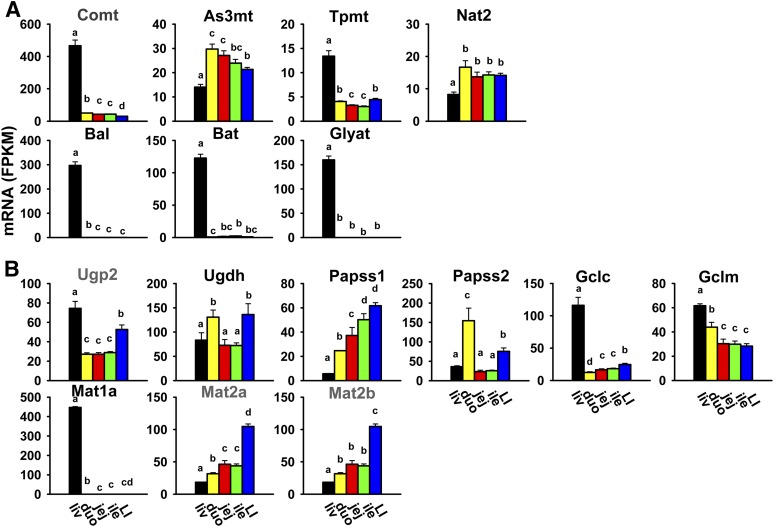
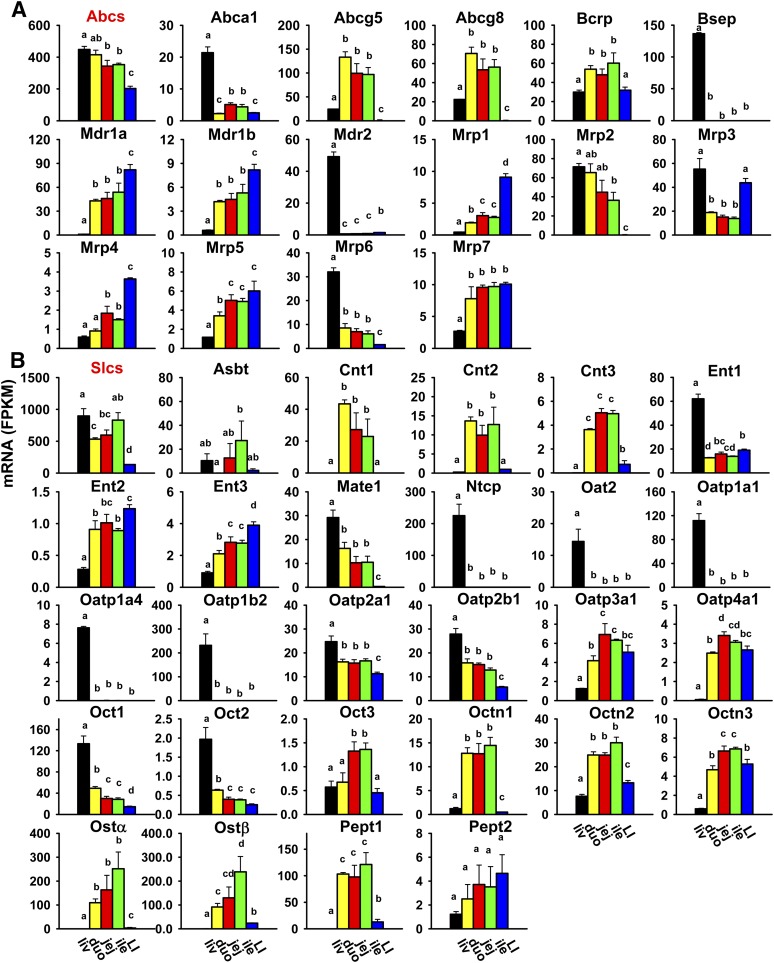
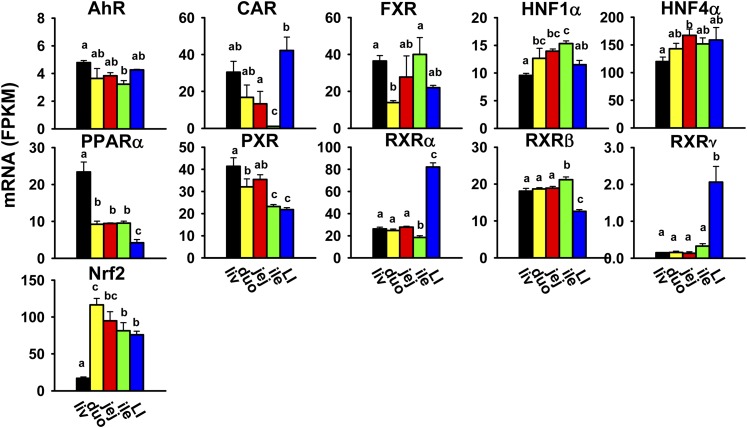
Previous reports on tissue distribution of xenobiotic-processing genes (XPGs) have limitations, because many non-cytochrome P450 phase I enzymes have not been investigated, and one cannot compare the real mRNA abundance of multiple XPGs using conventional quantification methods. Therefore, this study aimed to quantify and compare the mRNA abundance of all major XPGs in the liver and intestine using RNA sequencing. The mRNA profiles of 304 XPGs, including phase I, phase II enzymes, phase II cosubstrate synthetic enzymes, xenobiotic transporters, as well as xenobiotic-related transcription factors, were systematically examined in the liver and various sections of the intestine in adult male C57BL/6J mice. By two-way hierarchical clustering, over 80% of the XPGs had tissue-divergent expression, which partitioned into liver-predominant, small intestine-predominant, and large intestine-predominant patterns. Among the genes, 54% were expressed highest in the liver, 21% in the duodenum, 4% in the jejunum, 6% in the ileum, and 15% in the large intestine. The highest-expressed XPG in the liver was Mgst1; in the duodenum, Cyp3a11; in the jejunum and ileum, Ces2e; and in the large intestine, Cyp2c55. Interestingly, XPGs in the same family usually exhibited highly different tissue distribution patterns, and many XPGs were almost exclusively expressed in one tissue and minimally expressed in others. In conclusion, the present study is among the first and the most comprehensive investigations of the real mRNA abundance and tissue-divergent expression of all major XPGs in mouse liver and intestine, which aids in understanding the tissue-specific biotransformation and toxicity of drugs and other xenobiotics.
Copyright © 2016 by The American Society for Pharmacology and Experimental Therapeutics.
Figures
Similar articles
-
RNA-Seq Profiling of Intestinal Expression of Xenobiotic Processing Genes in Germ-Free Mice.Drug Metab Dispos. 2017 Dec;45(12):1225-1238. doi: 10.1124/dmd.117.077313. Epub 2017 Sep 22. Drug Metab Dispos. 2017. PMID: 28939687 Free PMC article.
-
Short-term calorie restriction feminizes the mRNA profiles of drug metabolizing enzymes and transporters in livers of mice.Toxicol Appl Pharmacol. 2014 Jan 1;274(1):137-46. doi: 10.1016/j.taap.2013.11.003. Epub 2013 Nov 13. Toxicol Appl Pharmacol. 2014. PMID: 24240088 Free PMC article.
-
Effects of aging on mRNA profiles for drug-metabolizing enzymes and transporters in livers of male and female mice.Drug Metab Dispos. 2012 Jun;40(6):1216-25. doi: 10.1124/dmd.111.044461. Epub 2012 Mar 23. Drug Metab Dispos. 2012. PMID: 22446518 Free PMC article.
-
Xenobiotic-metabolizing cytochrome P450 enzymes in the human feto-placental unit: role in intrauterine toxicity.Crit Rev Toxicol. 1998 Jan;28(1):35-72. doi: 10.1080/10408449891344173. Crit Rev Toxicol. 1998. PMID: 9493761 Review.
-
Xenobiotic-induced transcriptional regulation of xenobiotic metabolizing enzymes of the cytochrome P450 superfamily in human extrahepatic tissues.Curr Drug Metab. 2008 Feb;9(2):129-43. doi: 10.2174/138920008783571774. Curr Drug Metab. 2008. PMID: 18288955 Review.
Cited by
-
RNA Sequencing Reveals Age and Species Differences of Constitutive Androstane Receptor-Targeted Drug-Processing Genes in the Liver.Drug Metab Dispos. 2017 Jul;45(7):867-882. doi: 10.1124/dmd.117.075135. Epub 2017 Feb 23. Drug Metab Dispos. 2017. PMID: 28232382 Free PMC article.
-
Identification of Flavin-Containing Monooxygenase 5 (FMO5) as a Regulator of Glucose Homeostasis and a Potential Sensor of Gut Bacteria.Drug Metab Dispos. 2017 Sep;45(9):982-989. doi: 10.1124/dmd.117.076612. Epub 2017 Jun 23. Drug Metab Dispos. 2017. PMID: 28646079 Free PMC article.
-
Differential regulation of intestinal efflux transporters by pregnancy in mice.Xenobiotica. 2017 Nov;47(11):989-997. doi: 10.1080/00498254.2016.1250292. Epub 2017 Jan 3. Xenobiotica. 2017. PMID: 28043194 Free PMC article.
-
Adipose Tissue and Endocrine-Disrupting Chemicals: Does Sex Matter?Int J Environ Res Public Health. 2020 Dec 15;17(24):9403. doi: 10.3390/ijerph17249403. Int J Environ Res Public Health. 2020. PMID: 33333918 Free PMC article. Review.
-
RNA-Seq Profiling of Intestinal Expression of Xenobiotic Processing Genes in Germ-Free Mice.Drug Metab Dispos. 2017 Dec;45(12):1225-1238. doi: 10.1124/dmd.117.077313. Epub 2017 Sep 22. Drug Metab Dispos. 2017. PMID: 28939687 Free PMC article.
References
-
- Alnouti Y, Klaassen CD. (2006) Tissue distribution and ontogeny of sulfotransferase enzymes in mice. Toxicol Sci 93:242–255. - PubMed
-
- Alnouti Y, Klaassen CD. (2008) Tissue distribution, ontogeny, and regulation of aldehyde dehydrogenase (Aldh) enzymes mRNA by prototypical microsomal enzyme inducers in mice. Toxicol Sci 101:51–64. - PubMed
-
- Alnouti Y, Petrick JS, Klaassen CD. (2006) Tissue distribution and ontogeny of organic cation transporters in mice. Drug Metab Dispos 34:477–482. - PubMed
-
- Badenhorst CP, Jooste M, van Dijk AA. (2012) Enzymatic characterization and elucidation of the catalytic mechanism of a recombinant bovine glycine N-acyltransferase. Drug Metab Dispos 40:346–352. - PubMed
Publication types
MeSH terms
Substances
Grants and funding
LinkOut - more resources
Full Text Sources
Other Literature Sources
Molecular Biology Databases
