Growth resumption from stationary phase reveals memory in Escherichia coli cultures
- PMID: 27048851
- PMCID: PMC4822139
- DOI: 10.1038/srep24055
Growth resumption from stationary phase reveals memory in Escherichia coli cultures
Abstract
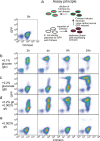
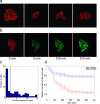
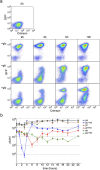
Frequent changes in nutrient availability often result in repeated cycles of bacterial growth and dormancy. The timing of growth resumption can differ among isogenic cells and delayed growth resumption can lead to antibiotic tolerant persisters. Here we describe a correlation between the timing of entry into stationary phase and resuming growth in the next period of cell proliferation. E. coli cells can follow a last in first out rule: the last ones to shut down their metabolism in the beginning of stationary phase are the first to recover in response to nutrients. This memory effect can last for several days in stationary phase and is not influenced by environmental changes. We observe that the speed and heterogeneity of growth resumption depends on the carbon source. A good carbon source (glucose) can promote rapid growth resumption even at low concentrations, and is seen to act more like a signal than a growth substrate. Heterogeneous growth resumption can protect the population from adverse effect of stress, investigated here using heat-shock, because the stress-resilient dormant cells are always present.
Figures


Similar articles
-
Persisters: a distinct physiological state of E. coli.BMC Microbiol. 2006 Jun 12;6:53. doi: 10.1186/1471-2180-6-53. BMC Microbiol. 2006. PMID: 16768798 Free PMC article.
-
Aggregation of Escherichia coli proteins during stationary phase depends on glucose and oxygen availability.Res Microbiol. 2008 Nov-Dec;159(9-10):651-7. doi: 10.1016/j.resmic.2008.09.008. Epub 2008 Oct 17. Res Microbiol. 2008. PMID: 18983914
-
Cell division in Escherichia coli cultures monitored at single cell resolution.BMC Microbiol. 2008 Apr 23;8:68. doi: 10.1186/1471-2180-8-68. BMC Microbiol. 2008. PMID: 18430255 Free PMC article.
-
[Stationary phase in Escherichia coli].Rev Latinoam Microbiol. 2005 Jul-Dec;47(3-4):92-101. Rev Latinoam Microbiol. 2005. PMID: 17061534 Review. Spanish.
-
[Role of Escherichia coli molecular chaperones in the protection of bacterial cells against irreversible aggregation induced by heat shock].Postepy Biochem. 2005;51(2):146-53. Postepy Biochem. 2005. PMID: 16209352 Review. Polish.
Cited by
-
Escherichia coli with a Tunable Point Mutation Rate for Evolution Experiments.G3 (Bethesda). 2020 Aug 5;10(8):2671-2681. doi: 10.1534/g3.120.401124. G3 (Bethesda). 2020. PMID: 32503807 Free PMC article.
-
Tracking bacterial lineages in complex and dynamic environments with applications for growth control and persistence.Nat Microbiol. 2021 Jun;6(6):783-791. doi: 10.1038/s41564-021-00900-4. Epub 2021 May 20. Nat Microbiol. 2021. PMID: 34017106 Free PMC article.
-
Bacterial memory in antibiotic resistance evolution and nanotechnology in evolutionary biology.iScience. 2023 Jul 20;26(8):107433. doi: 10.1016/j.isci.2023.107433. eCollection 2023 Aug 18. iScience. 2023. PMID: 37575196 Free PMC article. Review.
-
Ribosome Provisioning Activates a Bistable Switch Coupled to Fast Exit from Stationary Phase.Mol Biol Evol. 2019 May 1;36(5):1056-1070. doi: 10.1093/molbev/msz041. Mol Biol Evol. 2019. PMID: 30835283 Free PMC article.
-
Population-level control of two manganese oxidases expands the niche for bacterial manganese biomineralization.NPJ Biofilms Microbiomes. 2025 Mar 24;11(1):50. doi: 10.1038/s41522-025-00670-5. NPJ Biofilms Microbiomes. 2025. PMID: 40122939 Free PMC article.
References
-
- Sleight S. C. & Lenski R. E. Evolutionary adaptation to freeze-thaw-growth cycles in Escherichia coli. Physiol. Biochem. Zool. 80, 370–85 (2007). - PubMed
-
- Levin-Reisman I. et al.. Automated imaging with ScanLag reveals previously undetectable bacterial growth phenotypes. Nat. Methods 7, 737–9 (2010). - PubMed
-
- Balaban N. Q., Merrin J., Chait R., Kowalik L. & Leibler S. Bacterial persistence as a phenotypic switch. Science 305, 1622–5 (2004). - PubMed
Publication types
MeSH terms
Substances
LinkOut - more resources
Full Text Sources
Other Literature Sources
Medical

