Combined Population Dynamics and Entropy Modelling Supports Patient Stratification in Chronic Myeloid Leukemia
- PMID: 27048866
- PMCID: PMC4822142
- DOI: 10.1038/srep24057
Combined Population Dynamics and Entropy Modelling Supports Patient Stratification in Chronic Myeloid Leukemia
Abstract
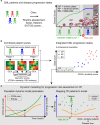
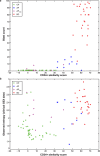
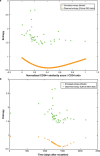
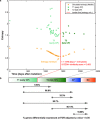
Modelling the parameters of multistep carcinogenesis is key for a better understanding of cancer progression, biomarker identification and the design of individualized therapies. Using chronic myeloid leukemia (CML) as a paradigm for hierarchical disease evolution we show that combined population dynamic modelling and CML patient biopsy genomic analysis enables patient stratification at unprecedented resolution. Linking CD34(+) similarity as a disease progression marker to patient-derived gene expression entropy separated established CML progression stages and uncovered additional heterogeneity within disease stages. Importantly, our patient data informed model enables quantitative approximation of individual patients' disease history within chronic phase (CP) and significantly separates "early" from "late" CP. Our findings provide a novel rationale for personalized and genome-informed disease progression risk assessment that is independent and complementary to conventional measures of CML disease burden and prognosis.
Conflict of interest statement
AS is a part-time employee at Bayer Technology Services GmbH. Bayer Technology Services GmbH provides Technology Services in the field of PBPK modelling and has currently no activities in the area of disease modelling in leukemia.
Figures

Similar articles
-
Evi1 defines leukemia-initiating capacity and tyrosine kinase inhibitor resistance in chronic myeloid leukemia.Oncogene. 2014 Oct 16;33(42):5028-38. doi: 10.1038/onc.2014.108. Epub 2014 Apr 21. Oncogene. 2014. PMID: 24747972 Free PMC article.
-
Differentiation status of primary chronic myeloid leukemia cells affects sensitivity to BCR-ABL1 inhibitors.Oncotarget. 2017 Apr 4;8(14):22606-22615. doi: 10.18632/oncotarget.15146. Oncotarget. 2017. PMID: 28186983 Free PMC article.
-
CD34+CD7+ leukemic progenitor cells may be involved in maintenance and clonal evolution of chronic myeloid leukemia.Clin Cancer Res. 2005 Jan 15;11(2 Pt 1):505-11. Clin Cancer Res. 2005. PMID: 15701834
-
Expression of CD25 on leukemic stem cells in BCR-ABL1+ CML: Potential diagnostic value and functional implications.Exp Hematol. 2017 Jul;51:17-24. doi: 10.1016/j.exphem.2017.04.003. Epub 2017 Apr 27. Exp Hematol. 2017. PMID: 28457753 Free PMC article. Review.
-
Stem cell maintenance and disease progression in chronic myeloid leukemia.Int J Hematol. 2013 Dec;98(6):641-7. doi: 10.1007/s12185-013-1318-8. Epub 2013 Apr 4. Int J Hematol. 2013. PMID: 23550022 Review.
Cited by
-
Computational modeling reveals key factors driving treatment-free remission in chronic myeloid leukemia patients.NPJ Syst Biol Appl. 2024 Apr 27;10(1):45. doi: 10.1038/s41540-024-00370-4. NPJ Syst Biol Appl. 2024. PMID: 38678088 Free PMC article.
-
Comparative Gene Expression Analysis Reveals Similarities and Differences of Chronic Myeloid Leukemia Phases.Cancers (Basel). 2022 Jan 5;14(1):256. doi: 10.3390/cancers14010256. Cancers (Basel). 2022. PMID: 35008420 Free PMC article.
-
Leukemia in pregnancy: Diagnosis and therapeutic approach (Review).Mol Clin Oncol. 2024 Aug 21;21(5):79. doi: 10.3892/mco.2024.2777. eCollection 2024 Nov. Mol Clin Oncol. 2024. PMID: 39246846 Free PMC article. Review.
-
Multivariate Entropy Characterizes the Gene Expression and Protein-Protein Networks in Four Types of Cancer.Entropy (Basel). 2018 Feb 28;20(3):154. doi: 10.3390/e20030154. Entropy (Basel). 2018. PMID: 33265245 Free PMC article.
References
-
- Wong S. & Witte O. N. The BCR-ABL story: bench to bedside and back. Annu. Rev. Immunol. 22, 247–306 (2004). - PubMed
Publication types
MeSH terms
Substances
Grants and funding
LinkOut - more resources
Full Text Sources
Other Literature Sources
Medical
Miscellaneous

