Clinical Trial
. 2016 Jun;15(6):1412-24.
doi: 10.1158/1535-7163.MCT-15-0815. Epub 2016 Apr 5.

Plasma Metabolomic Changes following PI3K Inhibition as Pharmacodynamic Biomarkers: Preclinical Discovery to Phase I Trial Evaluation

Affiliations
Clinical Trial

Plasma Metabolomic Changes following PI3K Inhibition as Pharmacodynamic Biomarkers: Preclinical Discovery to Phase I Trial Evaluation

Joo Ern Ang et al. Mol Cancer Ther. 2016 Jun.

Abstract

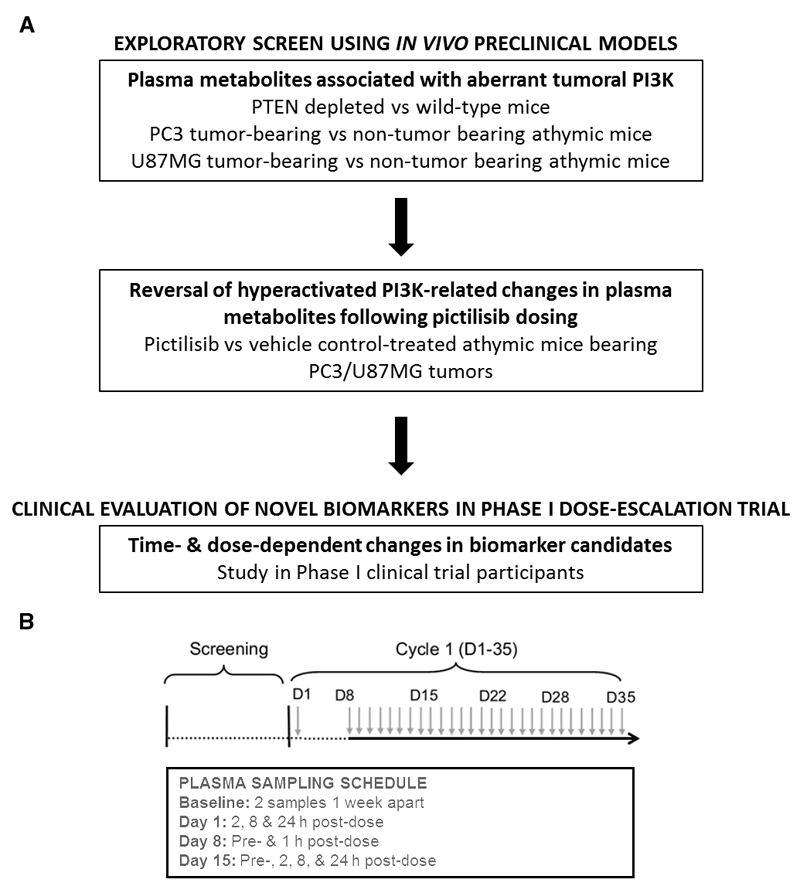
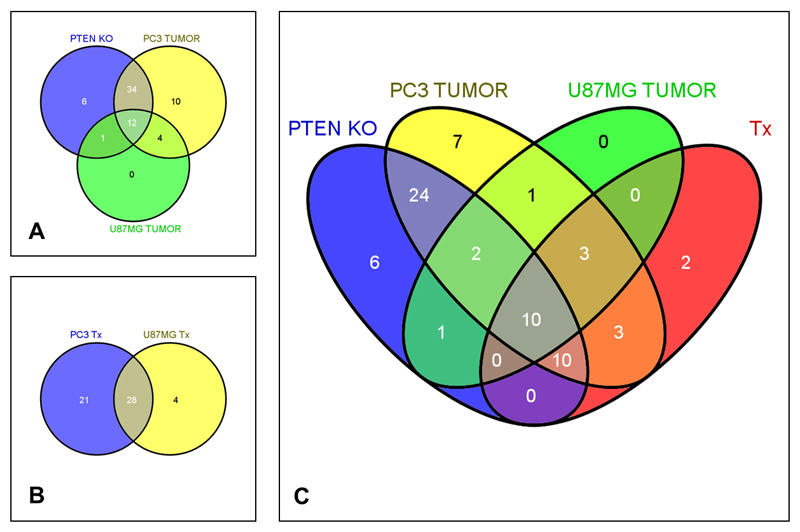
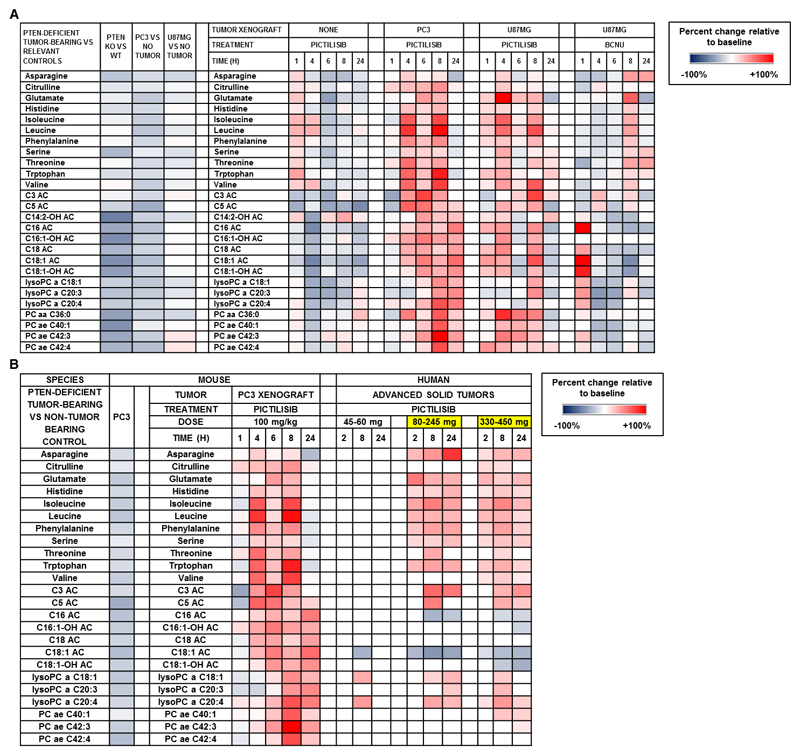
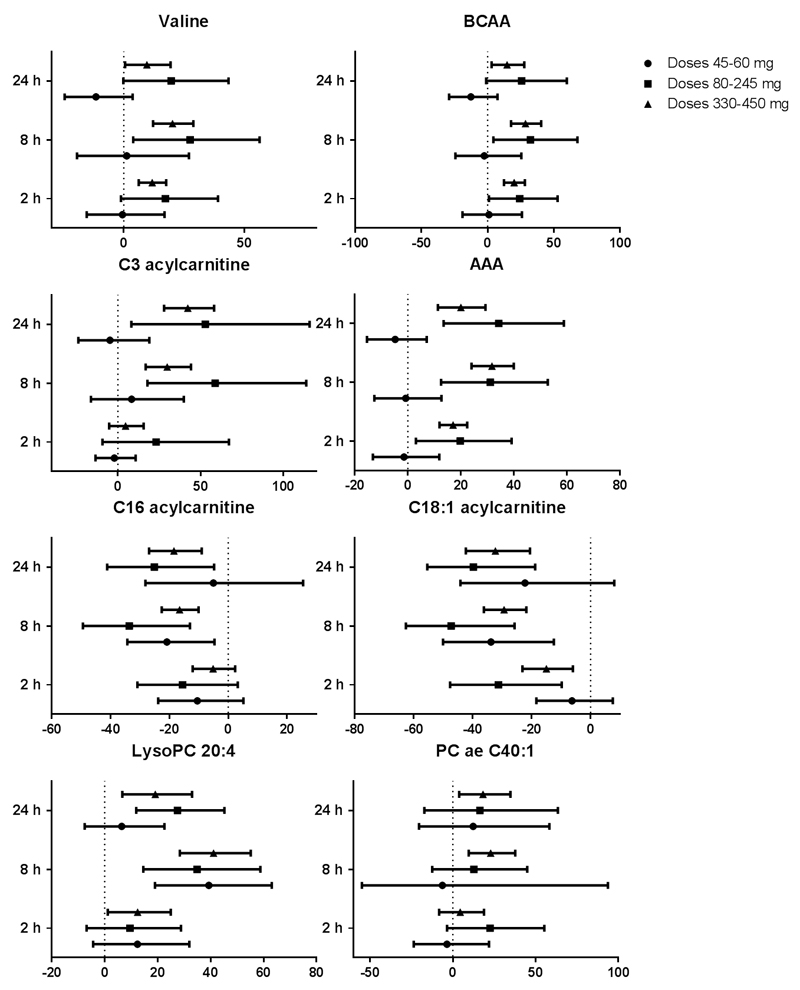
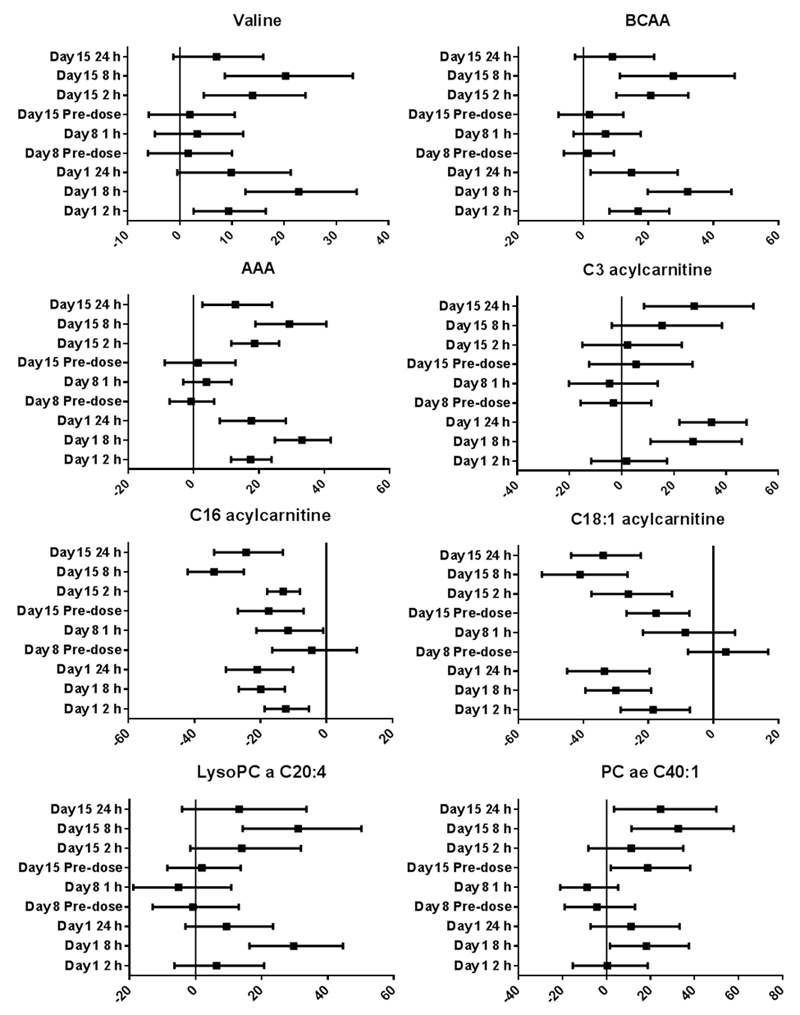
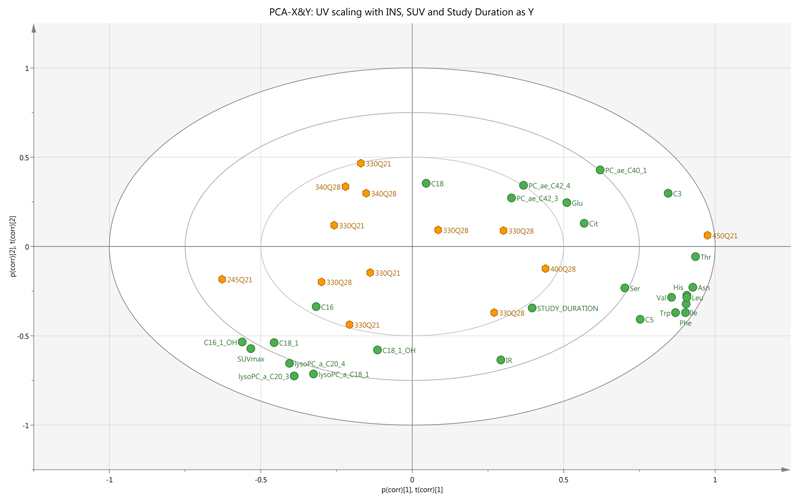
PI3K plays a key role in cellular metabolism and cancer. Using a mass spectrometry-based metabolomics platform, we discovered that plasma concentrations of 26 metabolites, including amino acids, acylcarnitines, and phosphatidylcholines, were decreased in mice bearing PTEN-deficient tumors compared with non-tumor-bearing controls and in addition were increased following dosing with class I PI3K inhibitor pictilisib (GDC-0941). These candidate metabolomics biomarkers were evaluated in a phase I dose-escalation clinical trial of pictilisib. Time- and dose-dependent effects were observed in patients for 22 plasma metabolites. The changes exceeded baseline variability, resolved after drug washout, and were recapitulated on continuous dosing. Our study provides a link between modulation of the PI3K pathway and changes in the plasma metabolome and demonstrates that plasma metabolomics is a feasible and promising strategy for biomarker evaluation. Also, our findings provide additional support for an association between insulin resistance, branched-chain amino acids, and related metabolites following PI3K inhibition. Mol Cancer Ther; 15(6); 1412-24. ©2016 AACR.


Conflict of interest statement

Disclosures and Potential Conflicts of Interest: J.E. Ang, Y. Asad, A. Henley, M. Valenti, G..Box, A.D.H. Brandon., S.A. Eccles, S.B. Kaye, P. Workman, and F.I. Raynaud are employees of The Institute of Cancer Research which has a financial interest in the development of pictilisib. L. Friedman and M. Derynck are employees of Genentech Inc. which is developing pictilisib. B. Vanhaesebroeck is a consultant to Activiomics (London, UK) and Karus Therapeutics (Oxford, UK). P. Workman is a founder of Piramed Pharma which has been acquired by Roche.

Figures

Figure 1
Figure 1
(A) Experimental workflow. (B) Schema illustrating once-daily dosing schedule of pictilisib (each green arrow representing a dose administered) with the plasma sampling schedule for metabolomic analysis summarized in the sub-table.
Figure 2
Figure 2
Venn diagrams showing the overlap in plasma metabolites between preclinical animal models: (A) PTEN +/- (depleted) versus wild-type littermates and athymic mice bearing PTEN null human PC3 prostate carcinoma or U87MG glioblastoma xenografts compared with non-tumor bearing age-matched controls; (B) treatment with pictilisib versus vehicle in PC3- and U87MG-bearing mice; and (C) overlap between changes in all 3 models in (A) and those common to both models in (B). Metabolites that were further evaluated in the clinical setting are enclosed by a thick black line. (Tx: treatment)
Figure 3
Figure 3
(A) Heat map of differences between transgenic PTEN-deficient tumor-bearing mice compared with their normal PTEN wild-type littermates (change relative to control) and changes across time in candidate plasma metabolite biomarkers following treatment with pictilisib or carmustine (relative to vehicle control) in tumor and non-tumor bearing mice. (a, acyl; aa, acyl-acyl; ae, acyl-alkyl; Cx:y, where x is the number of carbons in the fatty acid side chain; y is the number of double bonds in the fatty acid side chain; AC, acylcarnitine; DC, decarboxyl; M, methyl; OH, hydroxyl; PC, phosphatidylcholine) (B) Heat map (in right panel with header labelled ‘HUMAN’) of statistically significant changes (relative to baseline) in plasma concentrations of metabolite biomarker candidates in patients treated in the dose-escalation trial of pictilisib. Juxtaposed (in left panel with header labelled ‘MOUSE’) are changes seen in selected preclinical models as shown in Figure 3A. Highlighted in yellow are the dose levels of pictilisib at which modulation of mechanism-based pharmacodynamic biomarkers including phosphorylated S6 ribosomal protein and AKT, and 18FDG-PET were observed. (a, acyl; aa, acyl-acyl; ae, acyl-alkyl; Cx:y, where x is the number of carbons in the fatty acid side chain; y is the number of double bonds in the fatty acid side chain; AC, acylcarnitine; DC, decarboxyl; M, methyl; OH, hydroxyl; PC, phosphatidylcholine)
Figure 4
Figure 4
Percentage change relative to baseline of selected plasma metabolites at 2, 8 and 24 hours post-pictilisib dosing in 41 patients treated at different dose levels. Geometric means with 95% confidence intervals are represented in the plots. (BCAA, Branched chain amino-acids; AAA, aromatic amino-acids; PC, phosphatidylcholine)
Figure 5
Figure 5
Percentage change relative to baseline of selected plasma metabolites at planned time points over 2 weeks on pictilisib treatment in 17 patients treated at dose levels ≥330 mg once-daily. Geometric means with 95% confidence intervals are represented in the plots. Other details are as indicated in the legend to Figure 4.
Figure 6
Figure 6
PCA biplot comprising superimposed scatter and loading plots showing relationship between plasma metabolite changes (as X components), insulin resistance (IR), study duration and SUVmax (as Y components) as well as dose of pictilisib (labelled for each observation) (n=13 patients). Clustering of changes in levels of branched chain and aromatic amino acids, study duration and insulin resistance is noted; these variables are broadly related to inverse changes in SUVmax and changes in long chain acylcarnitines and lysophosphatidylcholine levels.

References

    1. Yap TA, Sandhu SK, Workman P, de Bono JS. Envisioning the future of early anticancer drug development. Nat Rev Cancer. 2010;10:514–23. - PubMed
    1. Ang JE, Kaye S, Banerji U. Tissue-based approaches to study pharmacodynamic endpoints in early phase oncology clinical trials. Curr Drug Targets. 2012;13:1525–34. - PMC - PubMed
    1. Sarker D, Workman P. Pharmacodynamic biomarkers for molecular cancer therapeutics. Adv Cancer Res. 2007;96:213–68. - PubMed
    1. Workman P. How much gets there and what does it do?: The need for better pharmacokinetic and pharmacodynamic endpoints in contemporary drug discovery and development. Curr Pharm Des. 2003;9:891–902. - PubMed
    1. Yap TA, Lorente D, Omlin A, Olmos D, de Bono JS. Circulating tumor cells: a multifunctional biomarker. Clin Cancer Res. 2014;20:2553–68. - PubMed

Publication types

MeSH terms

Substances