. 2017 Jan;10(1):162-171.
doi: 10.1038/mi.2016.35. Epub 2016 Apr 6.

Sphingosine-1-phosphate receptor-1 (S1P1) is expressed by lymphocytes, dendritic cells, and endothelium and modulated during inflammatory bowel disease

Affiliations

Sphingosine-1-phosphate receptor-1 (S1P1) is expressed by lymphocytes, dendritic cells, and endothelium and modulated during inflammatory bowel disease

T Karuppuchamy et al. Mucosal Immunol. 2017 Jan.

Abstract

The sphingosine-1-phosphate receptor-1 (S1P1) agonist ozanimod ameliorates ulcerative colitis, yet its mechanism of action is unknown. Here, we examine the cell subsets that express S1P1 in intestine using S1P1-eGFP mice, the regulation of S1P1 expression in lymphocytes after administration of dextran sulfate sodium (DSS), after colitis induced by transfer of CD4+CD45RBhi cells, and by crossing a mouse with TNF-driven ileitis with S1P1-eGFP mice. We then assayed the expression of enzymes that regulate intestinal S1P levels, and the effect of FTY720 on lymphocyte behavior and S1P1 expression. We found that not only T and B cells express S1P1, but also dendritic (DC) and endothelial cells. Furthermore, chronic but not acute inflammatory signals increased S1P1 expression, while the enzymes that control tissue S1P levels in mice and humans with inflammatory bowel disease (IBD) were uniformly dysregulated, favoring synthesis over degradation. Finally, we observed that FTY720 reduced T-cell velocity and induced S1P1 degradation and retention of Naïve but not effector T cells. Our data demonstrate that chronic inflammation modulates S1P1 expression and tissue S1P levels and suggests that the anti-inflammatory properties of S1PR agonists might not be solely due to their lymphopenic effects, but also due to potential effects on DC migration and vascular barrier function.


Figures

Figure 1
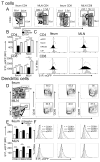
Figure 1. Expression of S1P1 on T, B, dendritic and endothelial cells
(A, B) Flow cytometry gating strategy (left panels) and S1P1-eGFP signal of CD4+T, CD8+T and B cells isolated from ileal LP and MLN of S1P1-eGFP mice. Representative histograms (right panels) from indicated cell subsets. (C) Flow cytometry analyses of DC (CD11chi MHC IIhi) gated as shown, isolated from ileal LP and MLN of S1P1-eGFP mice. Representative histograms. (D) Flow cytometry analyses of endothelial cells (CD31+CD45neg) isolated from ileal LP (upper panels) of S1P1-eGFP mice. Immunohistochemical localization of S1P1 in ileum (D1) and on high endothelial venules and lymphatics of MLN (D2). Representative plots and images from three or more independent experiments, n≥3 or more mice/group.
Figure 2
Figure 2. Expression of S1P1 is higher on naïve, central memory CD8+T cells and activated dendritic cells
(A) Gating strategy for naïve (CD44CD62L+), effector (CD44+CD62L) and central memory (CM: CD44+CD62L+) CD4+ and CD8+ T cells isolated from ileal LP and MLN of S1P1-eGFP mice. (B, C) MFI and representative histograms for S1P1 expression by naïve, effector and CM CD4+ and CD8+ T cells from indicated compartments. (D) Gating strategy for DC (CD11chigh/MHCIIhigh) isolated from the ileum and MLN of S1P1-eGFP mice and gated further based on their costimulatory molecule (CD40, CD80 and CD86) expression. (E, F) MFI and representative histograms for S1P1 expression by activated DC (CD40+, CD80+ and CD86+), compared with that of CD40, CD80 and CD86 DC. *p<0.05, **p<0.01, ***p<0.001 by two-tailed t test. Data are shown as mean ± SEM, n=3 mice/group and representative histograms from three independent experiments.
Figure 3
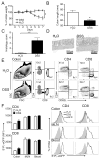
Figure 3. Acute inflammation did not modulate the expression of S1P1 on T cells
S1P1-eGFP mice were treated with 3% DSS or H2O (vehicle) for 7 days. (A, B) Weight loss curves and shortening of colon length (mm) of mice receiving DSS or H2O. (C) Histological inflammatory indices in colon of mice treated with DSS or H2O. (D) Representative micrographs of colon of S1P1-eGFP mice treated with DSS or H2O. (E) Flow cytometric analysis of CD4+T and CD8+T cells isolated from colonic LP of S1P1-eGFP mice treated with DSS or H2O. (F) Bar graph represents MFI for S1P1 expression by CD4+T and CD8+T cells from colonic LP, MLN and blood of S1P1-eGFP mice treated with DSS or H2O. Representative histograms. Scale bar, 200 μm. Shaded histograms are control for eGFP (eGFP-); line and dashed histograms are from DSS- and H2O-treated mice respectively. Data are shown as mean ± SEM. *p<0.05, **p<0.01, ***p<0.001 by two-tailed t test, n=5 mice/group.
Figure 4
Figure 4. Chronic inflammation upregulated S1P1 on adoptively transferred T cells after development of colitis
CD4+CD45RBhi cells from S1P1-eGFP mice were adoptively transferred into Rag1−/− mice. Control group was co-transferred with CD4+CD45RBlo cells. (A) Weight loss curve suggests development of colitis after 3 weeks post cell transfer. (B, C) Histological assessment of colon confirmed development of colitis compared with co-transferred controls. (D) Gating strategy for effector CD4+T cells isolated from colon of mice with and without colitis. (E) Percentage of effector CD4 in mice with and without colitis. (F) MFI for S1P1 expression by effector CD4+T cells in colon, MLN and blood in mice with and without colitis. Representative histograms. Data are shown as mean ± SEM. *p<0.05, **p<0.01, ***p<0.001 by two-tailed t test, n=4 mice/group.
Figure 5
Figure 5. Chronic inflammation modulated S1P1 expression on T, dendritic and endothelial cells of TNFΔARE mice
(A, B) Naïve (CD44CD62L+), effector (CD44+CD62L) and central memory (CM: CD44+CD62L+) CD4+ and CD8+ T cells were isolated from ileal LP and MLN of S1P1-eGFP (WT) and TNFΔARE/S1P1-eGFP (TNFΔARE) mice and gated as shown. Bar graph represents MFI for S1P1 expression by total, naïve, effector and central memory CD4+T and CD8+T cells from ileum LP and MLN of TNFΔARE/S1P1-eGFP mice compared with S1P1-eGFP mice. Representative histograms. (C) Absolute counts of DC (CD11chi MHCIIhi cells) from ileal LP, MLN and spleen of TNFΔARE/S1P1-eGFP mice compared with S1P1-eGFP mice. MFI for S1P1 expression by DC in indicated tissues of S1P1-eGFP and TNFΔARE/S1P1-eGFP mice. Representative histograms. (D) Immunohistochemistry and three-dimensional reconstruction of ileum for S1P1 expression in mice with and without ileitis. Data are shown as mean ± SEM. *p<0.05, **p<0.01, ***p<0.001 by two-tailed t test, n=5 mice/group.
Figure 6
Figure 6. Inflammation alters the expression of enzymes that regulate tissue S1P levels
Analyses of mRNA expression of enzymes that control S1P levels (Sphk1, sphingosine kinase 1; Sphk2, sphingosine kinase 2; Sgpl1, sphingosine-1-phosphate lyase; SGPP1, sphingosine-1-phosphate phosphatase 1; SGPP2, sphingosine-1-phosphate phosphatase 2; Spns2 (Spinster homolog 2) was performed by real-time qRT-PCR on intestinal tissues from mice and humans with IBD, compared with respective normal controls, (A) Patients with and without ulcerative colitis (n=8/group), (B) Patients with and without Crohn’s disease (n=8/group), (C) Mice treated with DSS or vehicle (H2O) (n=4/group), (D) Mice with (CD45RBHi) or without (CD45RBHi+Lo) T cell transfer colitis (n=4–6/group), (E) Uninflamed AKR and SAMP1/YitFc with spontaneous ileitis (n=7/group) and (F) Normal C57BL/6 and ileitic TNFΔARE (n=9/group). Data are shown as mean ± SEM. *p<0.05, **p<0.01, ***p<0.001 by two-tailed t test.
Figure 7
Figure 7. FTY720 reduced velocity of MLN lymphocytes, depleted naïve and central memory T cells from circulation and downregulated S1P1 expression on T, B and endothelial cells in mice with chronic ileitis
(A) Sorted T cells from DsRed mice were transferred into TNFΔARE mice. 16 hours later, the effect of FTY720-P on cell behavior was analyzed via intravital microscopy in MLN explants. Cell tracks from point of origin illustrate directional movement after FTY720-P or vehicle. Analyses show the effect of FTY720-P on cell velocity (data from 3 experiments, S.D.****p<0.0001). (B) Percentage of circulating naïve, effector and central memory T cells in blood of TNFΔARE/S1P1-eGFP mice treated with FTY720 (3 mg/kg) or vehicle for 6 weeks. (C) S1P1 expression (MFI) of CD4+T cells, CD8+T cells and B cells (B220+) from blood, endothelial cells (CD45 CD31+) isolated from ileal LP of TNFΔARE/S1P1-eGFP mice treated with FTY720 (3 mg/kg) or vehicle for 6 weeks. (Data from 3 independent experiments, n=5, *p<0.05, **p<0.01, ***p<0.001 by two-tailed t test)

References

    1. Feagan BG, et al. Vedolizumab as induction and maintenance therapy for ulcerative colitis. N Engl J Med. 2013;369:699–710. - PubMed
    1. Sandborn WJ, et al. Vedolizumab as induction and maintenance therapy for Crohn’s disease. N Engl J Med. 2013;369:711–721. - PubMed
    1. Ghosh S, et al. Natalizumab for active Crohn’s disease. N Engl J Med. 2003;348:24–32. - PubMed
    1. Sandborn W, et al. 445 The TOUCHSTONE Study. A Randomized, Double-Blind, Placebo-Controlled Induction Trial of an Oral S1P Receptor Modulator (RPC1063) in Moderate to Severe Ulcerative Colitis. Gastroenterology. 148:S-93.
    1. Zhang H, Desai NN, Olivera A, Seki T, Brooker G, Spiegel S. Sphingosine-1-phosphate, a novel lipid, involved in cellular proliferation. J Cell Biol. 1991;114:155–167. - PMC - PubMed

MeSH terms