

The Haze Nightmare Following the Economic Boom in China: Dilemma and Tradeoffs
- PMID: 27049395
- PMCID: PMC4847064
- DOI: 10.3390/ijerph13040402
The Haze Nightmare Following the Economic Boom in China: Dilemma and Tradeoffs
Abstract
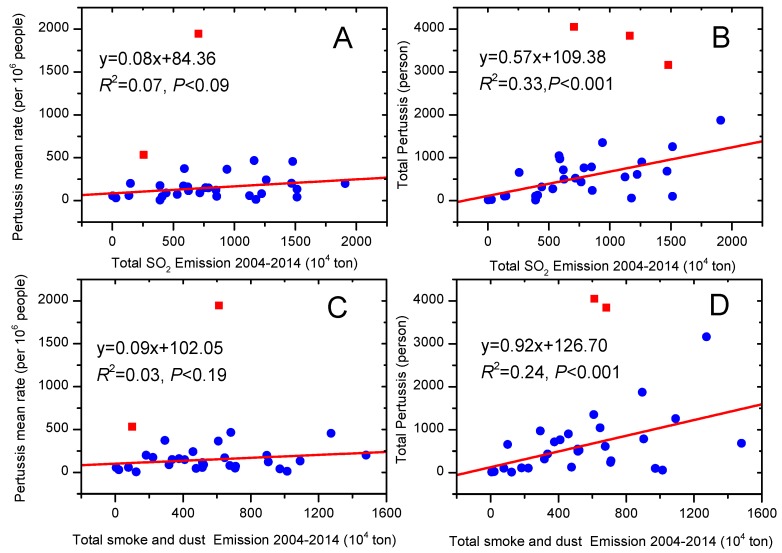
This study aims to expand on a deeper understanding of the relationship between rapid economic development and ensuing air pollution in China. The database includes the gross domestic product (GDP), the value added of a secondary industry, the per capita GDP (PGDP), greenhouse gases emissions, and PM2.5 concentrations. The results indicate that China's PGDP has continued to rise over the past decade, and the rate of PGDP slowed down from 1980 to 2004 (slope = 5672.81, R² = 0.99, p < 0.001) but was significantly lower than that from the year 2004 to 2013 (slope = 46,911.08, R² > 0.99, p < 0.001). Unfortunately, we found that total coal consumption, annual steel production, and SO₂ emission had been continually growing as the overall economy expands at temporal scale, with the coefficient of determinations greater than 0.98 (p < 0.001). Considering the spatial pattern aspect, we also found a significant relationship between GDP and greenhouse gases. Meanwhile, severe air pollution has negatively impacted the environment and human health, particularly in some highlighted regions. The variation explained by both total SO₂ emission and total smoke and dust emission were 33% (p < 0.001) and 24% (p < 0.01) for the rate of total pertussis at temporal scale, respectively. Furthermore, at the spatial scale, pulmonary tuberculosis rates and pertussis mainly occurred in area with serious air pollution (economically developed region). It can be summarized that the extensive mode of economic growth has brought a number of serious environment and human health problems. Thus, a new policy framework has been proposed to meet the goals of maintaining a healthy economy without harming natural environment, which may prove integral, especially when coupled with long-term national strategic development plans.
Keywords: PM2.5; SO2 emissions; haze; industrial soot emissions; pertussis and pulmonary tuberculosis; policy framework.
Figures


References
-
- Lin B.Q., Liu X. Dilemma between economic development and energy conservation: Energy rebound effect in China. Energy. 2012;45:867–873. doi: 10.1016/j.energy.2012.06.077. - DOI
-
- Yuan X.L., Mu R.M., Zuo J., Wang Q.S. Economic development, energy consumption, and air pollution: A critical assessment in China. Hum. Ecol. Risk Assess. 2015;21:781–798. doi: 10.1080/10807039.2014.932204. - DOI
-
- Jo H.Y., Kim C.H. Identification of long-range transported haze phenomena and their meteorological features over northeast Asia. J. Appl. Meteorol. Clim. 2013;52:1318–1328. doi: 10.1175/JAMC-D-11-0235.1. - DOI
-
- Zhang R.H., Li Q., Zhang R.N. Meteorological conditions for the persistent severe fog and haze event over eastern China in January 2013. Sci. China Earth Sci. 2014;57:26–35.
Publication types
MeSH terms
Substances
LinkOut - more resources
Full Text Sources
Other Literature Sources
Medical
Miscellaneous
