. 2016 Apr 2;8(4):198.
doi: 10.3390/nu8040198.

Long-Term Fructose Intake Increases Adipogenic Potential: Evidence of Direct Effects of Fructose on Adipocyte Precursor Cells

Affiliations

Long-Term Fructose Intake Increases Adipogenic Potential: Evidence of Direct Effects of Fructose on Adipocyte Precursor Cells

María Guillermina Zubiría et al. Nutrients. .

Abstract

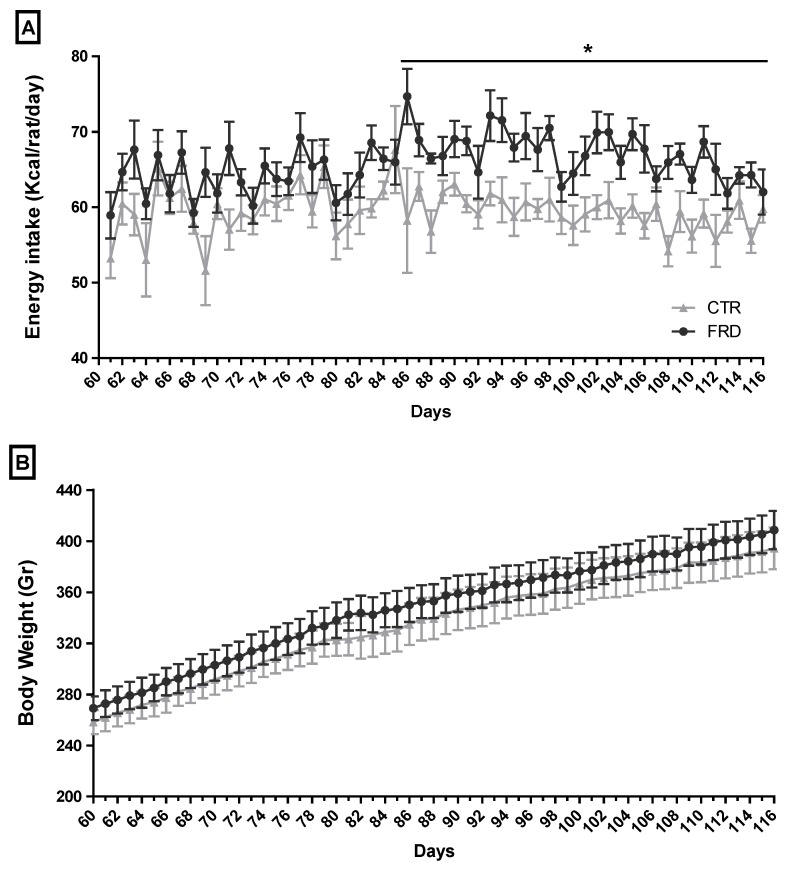
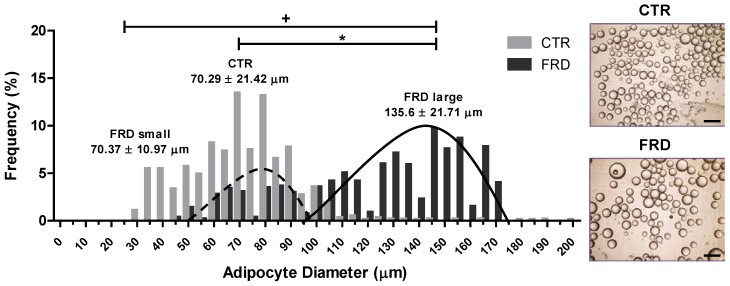
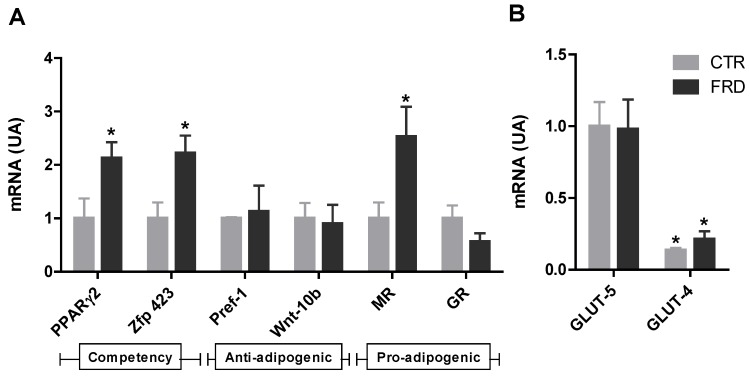
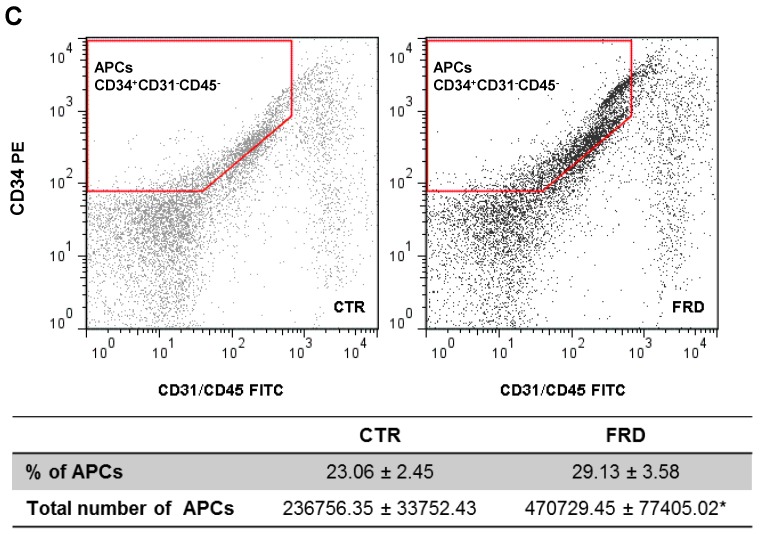
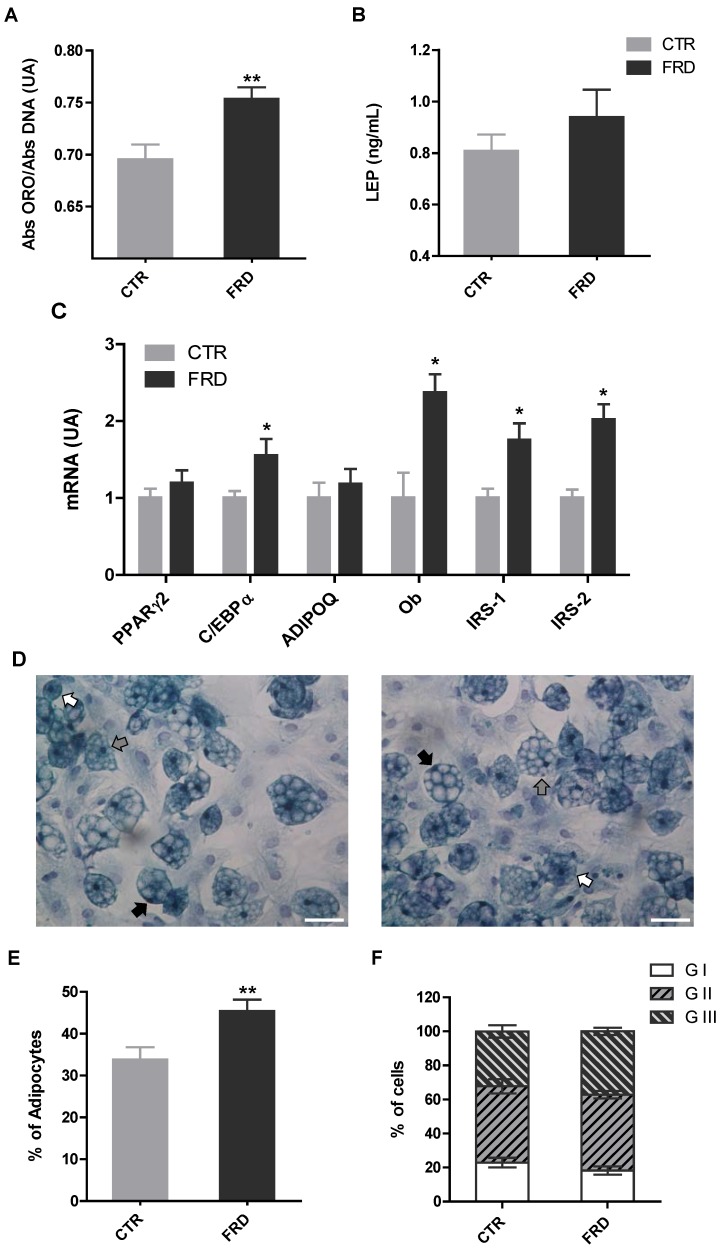
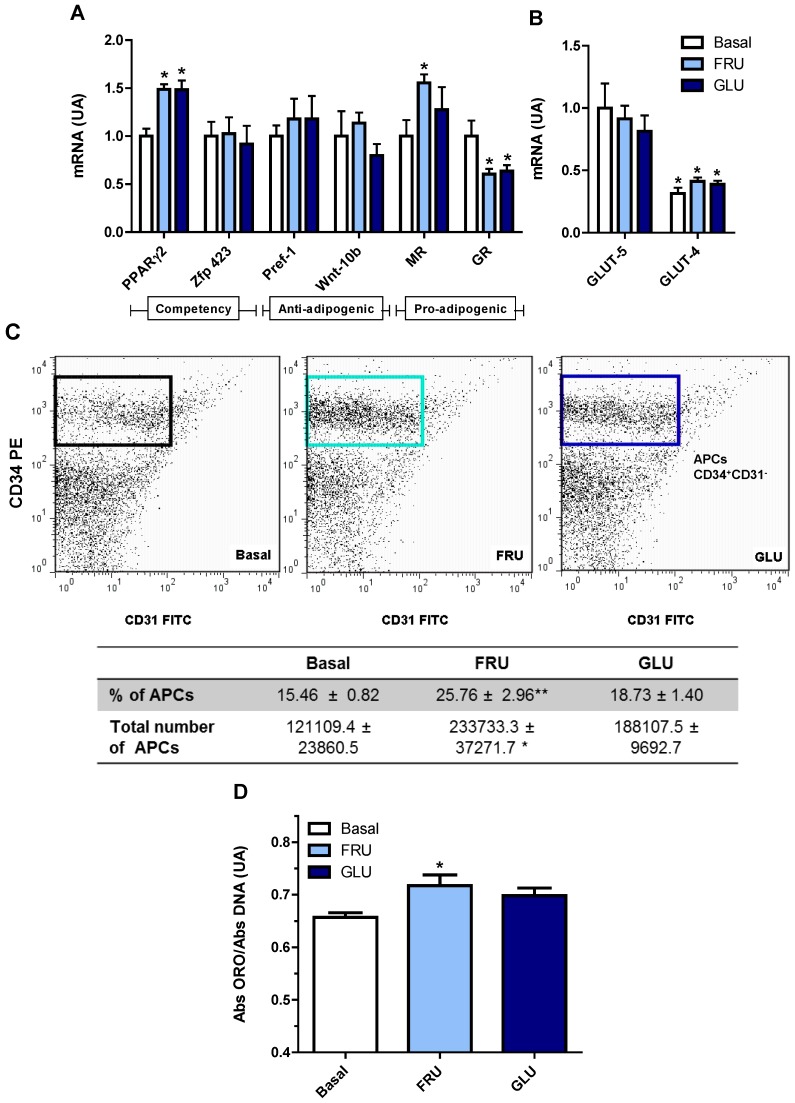
We have previously addressed that fructose rich diet (FRD) intake for three weeks increases the adipogenic potential of stromal vascular fraction cells from the retroperitoneal adipose tissue (RPAT). We have now evaluated the effect of prolonged FRD intake (eight weeks) on metabolic parameters, number of adipocyte precursor cells (APCs) and in vitro adipogenic potential from control (CTR) and FRD adult male rats. Additionally, we have examined the direct fructose effects on the adipogenic capacity of normal APCs. FRD fed rats had increased plasma levels of insulin, triglyceride and leptin, and RPAT mass and adipocyte size. FACS studies showed higher APCs number and adipogenic potential in FRD RPAT pads; data is supported by high mRNA levels of competency markers: PPARγ2 and Zfp423. Complementary in vitro experiments indicate that fructose-exposed normal APCs displayed an overall increased adipogenic capacity. We conclude that the RPAT mass expansion observed in eight week-FRD fed rats depends on combined accelerated adipogenesis and adipocyte hypertrophy, partially due to a direct effect of fructose on APCs.

Keywords: SVF cells; adipogenesis; precursor cell competency; retroperitoneal adipose tissue.


Figures

Figure 1
Figure 1
Food-derived energy intake and body weight of CTR and FRD rats. (A) Caloric intake and (B) body weight of CTR and FRD rats. Values are means ± SEM (n = 8 rats per group). * p < 0.05 vs. CTR values on the same day.
Figure 2
Figure 2
RPAT adipocyte diameter distribution. Dotted and continuous lines represent FRD small and large populations of adipocytes, respectively. Values are means ± SEM (n = 3 animals per group). Representative images of CTR and FRD mature adipocytes in cell suspension are shown (right, magnification 10×). Scale bars at 200 μm.
Figure 3
Figure 3
Effect of FRD intake on the APCs adipogenic potential and number. (A) Gene expression levels of cell competency (PPAR-γ2 and Zfp423), anti-adipogenic (Pref-1 and Wnt-10b) and pro-adipogenic (GR and MR) markers. * p < 0.05 vs. CTR values; (B) Gene expression levels of the specific fructose (GLUT-5) and glucose (GLUT-4) transporters in SVF cells in RPAT from CTR and FRD rats. Relative values to GLUT-5 expression in CTR cells. (AU: arbitrary units). Values are means ± SEM (n = 4 different experiments). * p < 0.05 vs. GLUT-5 values from each group; (C) APCs number in SVF in RPAT from CTR and FRD rats. APCs were identified by FACS analysis using CD34+CD45CD31 profile (indicated in red borders). Fluorescence profiles obtained for IgG isotype controls are shown in Figure S1 (Supplementary materials) FITC: fluorescein isothiocyanate; PE: phycoerythrin. Values are means ± SEM (n = 3/4 different experiments).
Figure 3
Figure 3
Effect of FRD intake on the APCs adipogenic potential and number. (A) Gene expression levels of cell competency (PPAR-γ2 and Zfp423), anti-adipogenic (Pref-1 and Wnt-10b) and pro-adipogenic (GR and MR) markers. * p < 0.05 vs. CTR values; (B) Gene expression levels of the specific fructose (GLUT-5) and glucose (GLUT-4) transporters in SVF cells in RPAT from CTR and FRD rats. Relative values to GLUT-5 expression in CTR cells. (AU: arbitrary units). Values are means ± SEM (n = 4 different experiments). * p < 0.05 vs. GLUT-5 values from each group; (C) APCs number in SVF in RPAT from CTR and FRD rats. APCs were identified by FACS analysis using CD34+CD45CD31 profile (indicated in red borders). Fluorescence profiles obtained for IgG isotype controls are shown in Figure S1 (Supplementary materials) FITC: fluorescein isothiocyanate; PE: phycoerythrin. Values are means ± SEM (n = 3/4 different experiments).
Figure 4
Figure 4
Parameters of terminal adipocyte differentiation. (A) Quantification of intracellular lipid accumulation and (B) leptin cell secretion (n = 5 different experiments with 12 wells per experiment); (C) Gene expression of fully-differentiated adipocyte markers (PPAR-γ2, C/EBPα, Adipoq and Ob, IRS-1 and IRS-2) on Dd 10 in cells isolated from CTR and FRD RPAT pads (n = 5/6 different experiments; AU: arbitrary units); (D) Representative fields containing in vitro differentiated CTR and FRD adipocytes (stained on Dd 10, magnification 40×), displaying different degrees of maturation depending on the nucleus position: GI, central (white arrows); GII, displaced from the center (gray arrows); and GIII: fully peripheral (black arrows). Scale bars at 50 μm; (E) Percentage of differentiated cells according to the presence of lipid droplets; (F) Percentages of cells according to the maturation stage. (n = 4/5 different experiments; data from 200/250 cells were recorded 1 in each experiment). Values are means ± SEM. * p < 0.05 vs. CTR values.
Figure 5
Figure 5
Direct effects of fructose on cultured APCs. (A) APCs gene expression of competency (PPAR-γ2 and Zfp423), anti-adipogenic (Pref-1 and Wnt-10b) and pro-adipogenic (GR and MR) markers. * p < 0.05 vs. CTR values; (B) APCs gene expression of specific fructose (GLUT-5) and glucose (GLUT-4) transporters, in Basal and FRU or GLU conditions, in cells from normal rats (AU: arbitrary units). Values are means ± SEM (n = 4 different experiments). * p < 0.05 vs. GLUT-5 values in each group; (C) Number of APCs in FRU- and GLU-exposed cells. APCs were identified by FACS analysis using the CD34+CD31 profile (boxes). Fluorescence profiles obtained for IgG isotype controls are shown in Figure S2 (Supplementary materials). FITC: fluorescein isothiocyanate; PE: phycoerythrin; (D) Intracellular lipid accumulation on Dd10 (n = 5 different experiments with 12 wells per experiment). Values are means ± SEM (n = 4 different experiments). * p < 0.05 vs. Basal values.

References

    1. Malik V.S., Popkin B.M., Bray G.A., Després J.-P., Willett W.C., Hu F.B. Sugar-sweetened beverages and risk of metabolic syndrome and type 2 diabetes: A meta-analysis. Diabetes Care. 2010;33:2477–2483. doi: 10.2337/dc10-1079. - DOI - PMC - PubMed
    1. Høstmark A.T. The Oslo health study: Soft drink intake is associated with the metabolic syndrome. Appl. Physiol. Nutr. Metab. 2010;35:635–642. doi: 10.1139/H10-059. - DOI - PubMed
    1. Johnson R.J., Segal M.S., Sautin Y., Nakagawa T., Feig D.I., Kang D.-H., Gersch M.S., Benner S., Sánchez-Lozada L.G. Potential role of sugar (fructose) in the epidemic of hypertension, obesity and the metabolic syndrome, diabetes, kidney disease, and cardiovascular disease. Am. J. Clin. Nutr. 2007;86:899–906. - PubMed
    1. Tappy L., Lê K.A., Tran C., Paquot N. Fructose and metabolic diseases: New findings, new questions. Nutrition. 2010;26:1044–1049. doi: 10.1016/j.nut.2010.02.014. - DOI - PubMed
    1. Parks E.J., Skokan L.E., Timlin M.T., Dingfelder C.S. Dietary sugars stimulate fatty acid synthesis in adults. J. Nutr. 2008;138:1039–1046. - PMC - PubMed

Publication types

LinkOut - more resources