

Circadian factors BMAL1 and RORα control HIF-1α transcriptional activity in nucleus pulposus cells: implications in maintenance of intervertebral disc health
- PMID: 27049729
- PMCID: PMC5029610
- DOI: 10.18632/oncotarget.8521
Circadian factors BMAL1 and RORα control HIF-1α transcriptional activity in nucleus pulposus cells: implications in maintenance of intervertebral disc health
Abstract
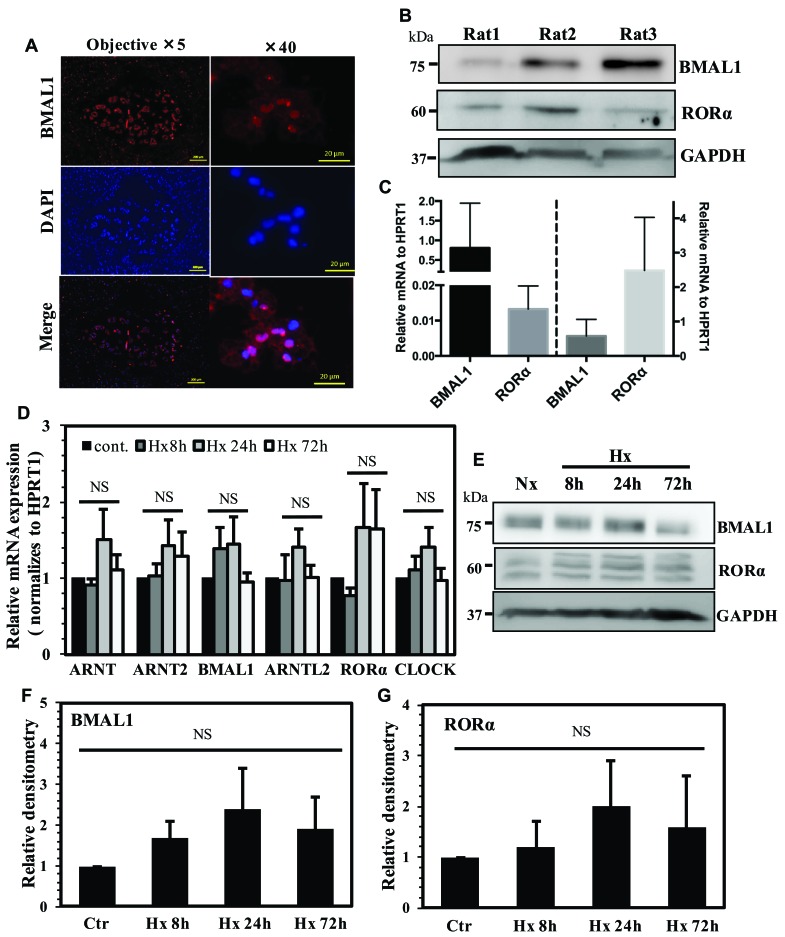
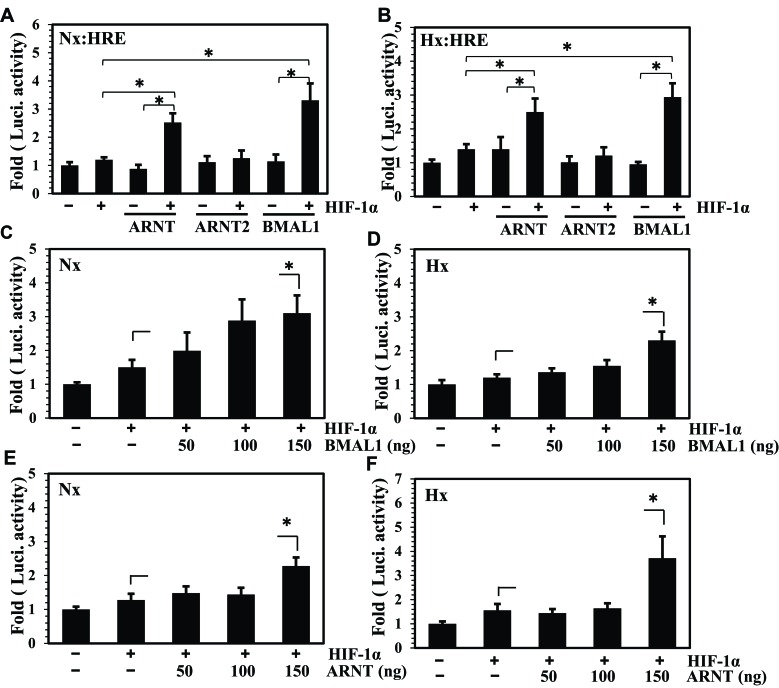
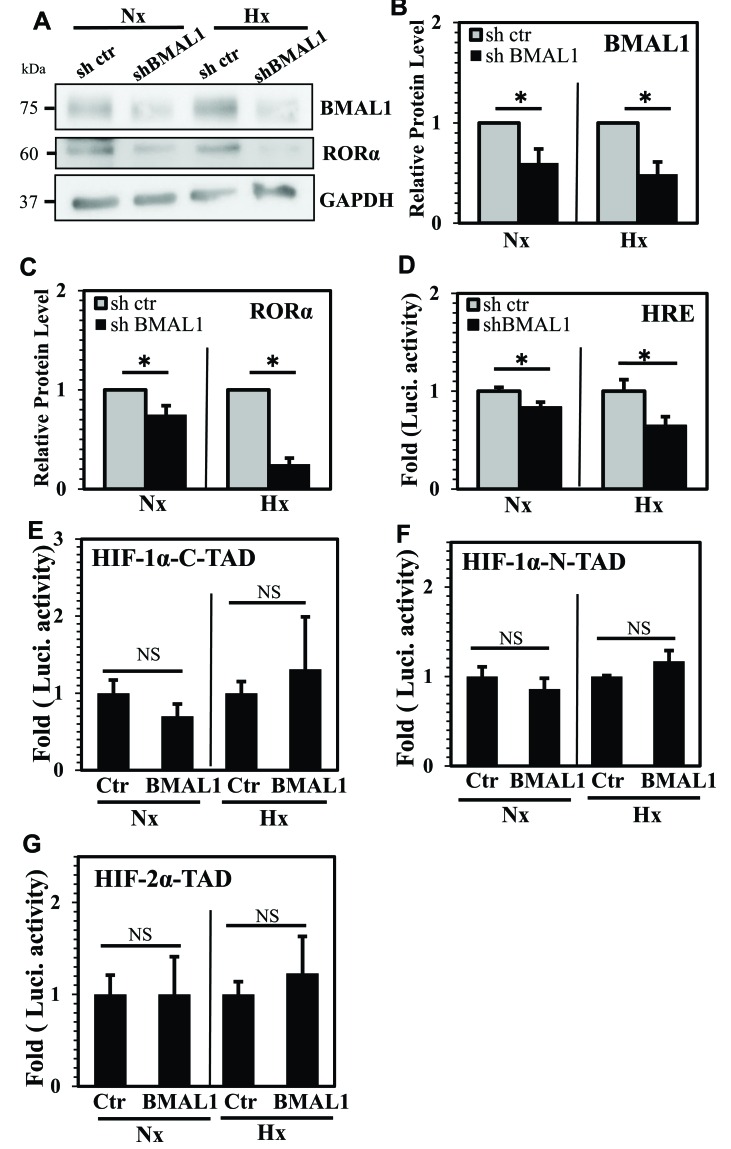
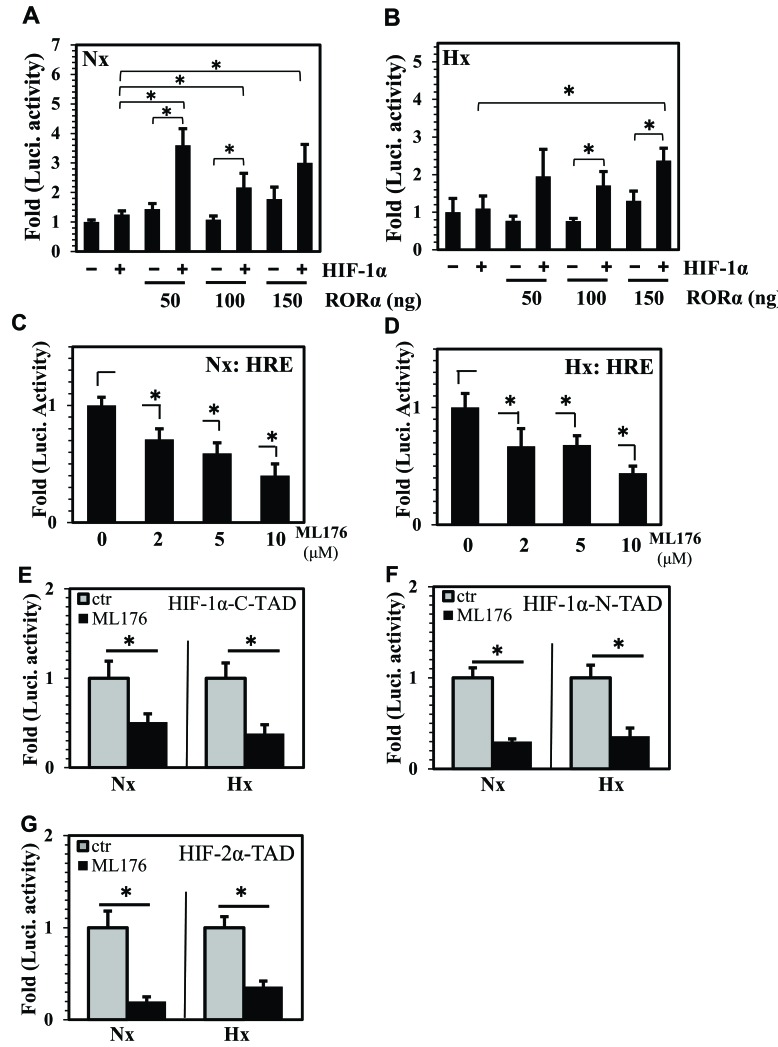
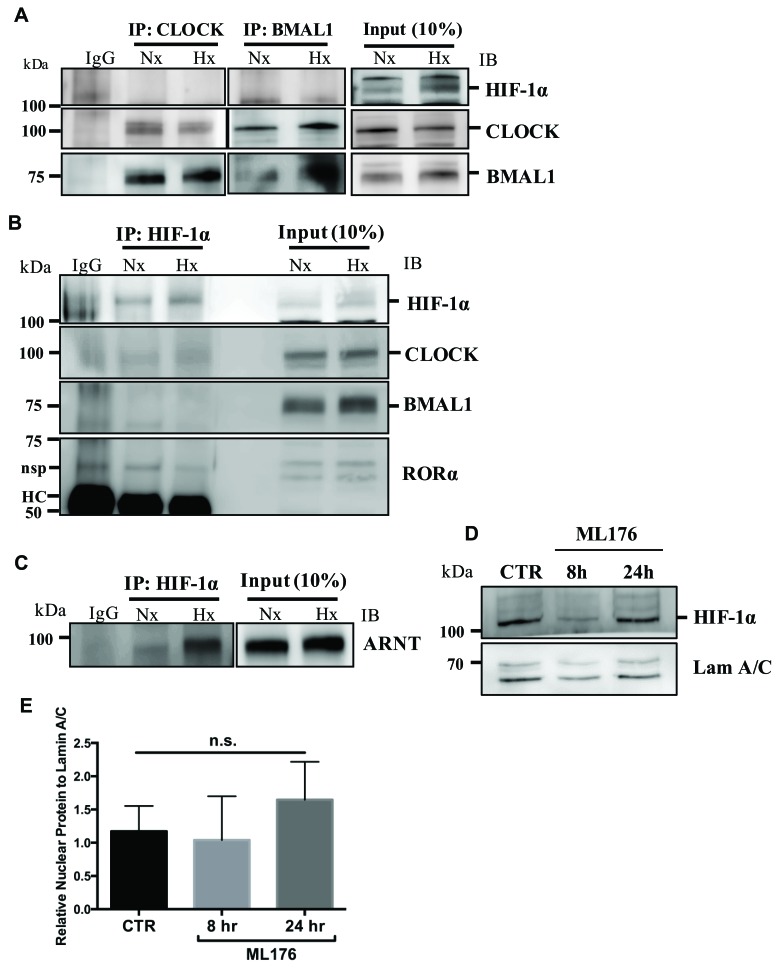
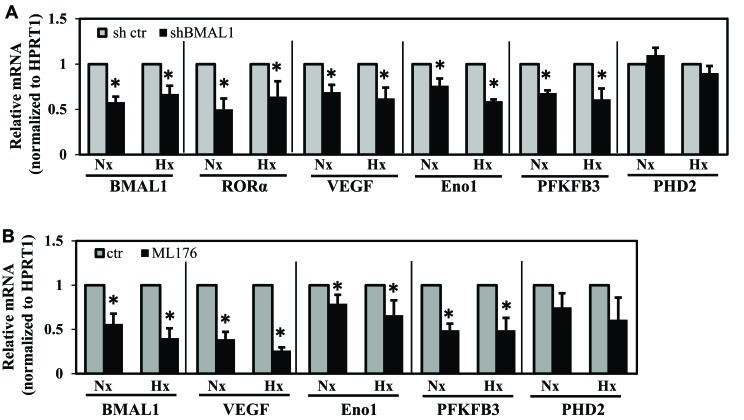
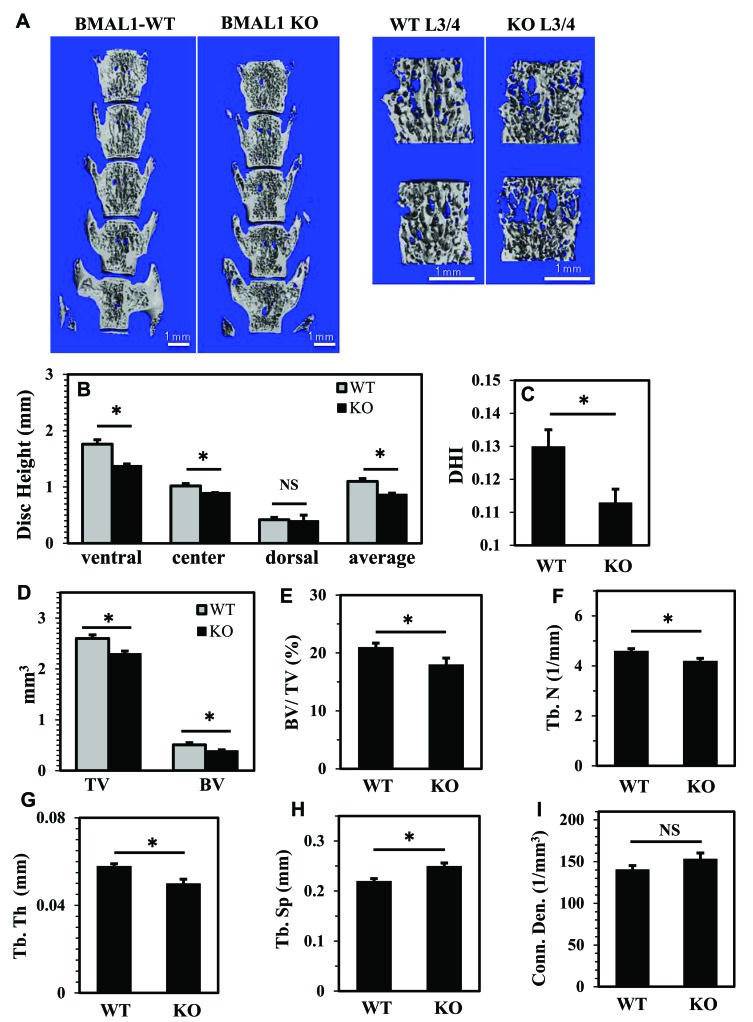
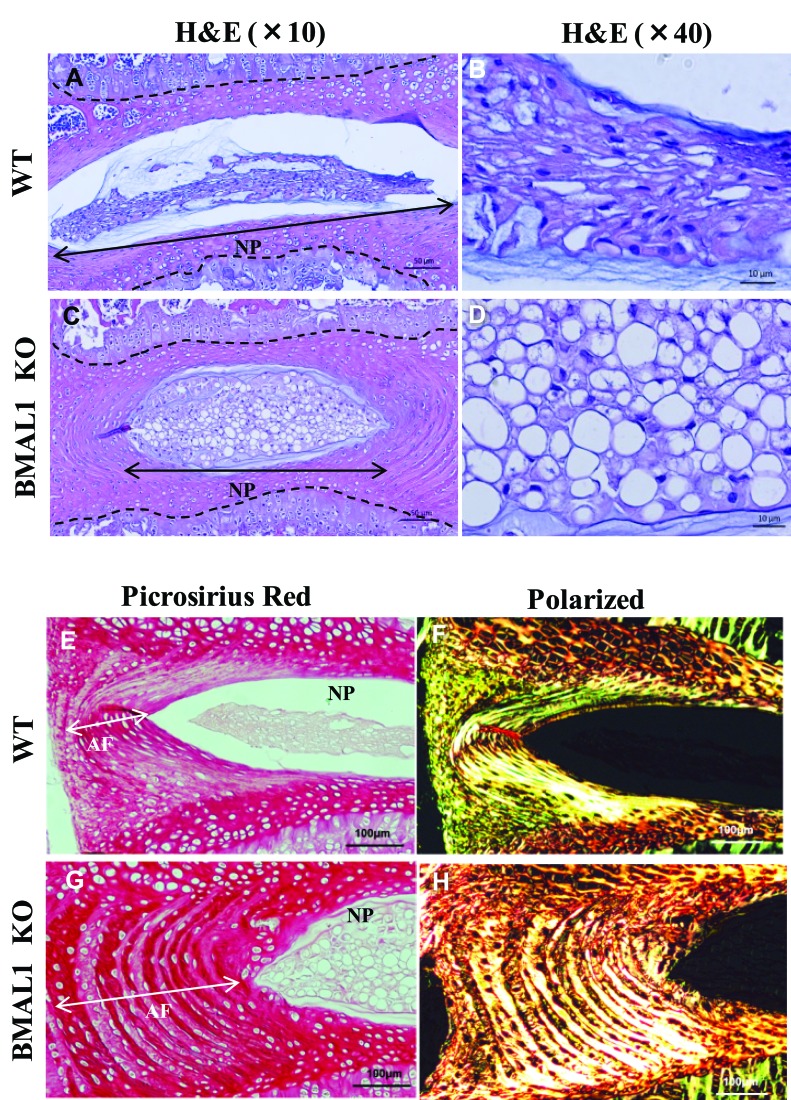
BMAL1 and RORα are major regulators of the circadian molecular oscillator. Since previous work in other cell types has shown cross talk between circadian rhythm genes and hypoxic signaling, we investigated the role of BMAL1 and RORα in controlling HIF-1-dependent transcriptional responses in NP cells that exist in the physiologically hypoxic intervertebral disc. HIF-1-dependent HRE reporter activity was further promoted by co-transfection with either BMAL1 or RORα. In addition, stable silencing of BMAL1 or inhibition of RORα activity resulted in decreased HRE activation. Inhibition of RORα also modulated HIF1α-TAD activity. Interestingly, immunoprecipitation studies showed no evidence of BMAL1, CLOCK or RORα binding to HIF-1α in NP cells. Noteworthy, stable silencing of BMAL1 as well as inhibition of RORα decreased expression of select HIF-1 target genes including VEGF, PFKFB3 and Eno1. To delineate if BMAL1 plays a role in maintenance of disc health, we studied the spinal phenotype of BMAL1-null mice. The lumbar discs of null mice evidenced decreased height, and several parameters associated with vertebral trabecular bone quality were also affected in nulls. In addition, null animals showed a higher ratio of cells to matrix in NP tissue and hyperplasia of the annulus fibrosus. Taken together, our results indicate that BMAL1 and RORα form a regulatory loop in the NP and control HIF-1 activity without direct interaction. Importantly, activities of these circadian rhythm molecules may play a role in the adaptation of NP cells to their unique niche.
Keywords: BMAL1; HIF-1; Pathology Section; RORα; intervertebral disc; nucleus pulposus.
Conflict of interest statement
CONFLICTS OF INTERESTS The authors declare no financial conflicts of interest.
Figures
Similar articles
-
RNA binding protein HuR regulates extracellular matrix gene expression and pH homeostasis independent of controlling HIF-1α signaling in nucleus pulposus cells.Matrix Biol. 2019 Apr;77:23-40. doi: 10.1016/j.matbio.2018.08.003. Epub 2018 Aug 7. Matrix Biol. 2019. PMID: 30092282 Free PMC article.
-
PHD3 is a transcriptional coactivator of HIF-1α in nucleus pulposus cells independent of the PKM2-JMJD5 axis.FASEB J. 2017 Sep;31(9):3831-3847. doi: 10.1096/fj.201601291R. Epub 2017 May 11. FASEB J. 2017. PMID: 28495754 Free PMC article.
-
Activation of Hypoxia-Inducible Factor-1α Signaling Pathway Has the Protective Effect of Intervertebral Disc Degeneration.Int J Mol Sci. 2021 Oct 21;22(21):11355. doi: 10.3390/ijms222111355. Int J Mol Sci. 2021. PMID: 34768786 Free PMC article.
-
Multiplicity of hypoxia-inducible transcription factors and their connection to the circadian clock in the zebrafish.Physiol Biochem Zool. 2015 Mar-Apr;88(2):146-57. doi: 10.1086/679751. Epub 2015 Jan 14. Physiol Biochem Zool. 2015. PMID: 25730270 Review.
-
Circadian rhythm, hypoxia, and cellular senescence: From molecular mechanisms to targeted strategies.Eur J Pharmacol. 2025 Mar 5;990:177290. doi: 10.1016/j.ejphar.2025.177290. Epub 2025 Jan 23. Eur J Pharmacol. 2025. PMID: 39863143 Review.
Cited by
-
Role of circadian clock in female embryo implantation.Front Cell Dev Biol. 2025 Jun 4;13:1607491. doi: 10.3389/fcell.2025.1607491. eCollection 2025. Front Cell Dev Biol. 2025. PMID: 40535570 Free PMC article. Review.
-
Targeting clock-controlled gene Nrf2 ameliorates inflammation-induced intervertebral disc degeneration.Arthritis Res Ther. 2022 Aug 3;24(1):181. doi: 10.1186/s13075-022-02876-w. Arthritis Res Ther. 2022. PMID: 35922862 Free PMC article.
-
The circadian rhythm in intervertebral disc degeneration: an autophagy connection.Exp Mol Med. 2020 Jan;52(1):31-40. doi: 10.1038/s12276-019-0372-6. Epub 2020 Jan 27. Exp Mol Med. 2020. PMID: 31983731 Free PMC article. Review.
-
The contribution of circadian clock to the biological processes.Front Mol Biosci. 2024 Jun 6;11:1387576. doi: 10.3389/fmolb.2024.1387576. eCollection 2024. Front Mol Biosci. 2024. PMID: 38903177 Free PMC article. Review.
-
Hypoxic Conditions Modulate Chondrogenesis through the Circadian Clock: The Role of Hypoxia-Inducible Factor-1α.Cells. 2024 Mar 14;13(6):512. doi: 10.3390/cells13060512. Cells. 2024. PMID: 38534356 Free PMC article. Review.
References
-
- Ludescher B, Effelsberg J, Martirosian P, Steidle G, Markert B, Claussen C, Schick F. T2-and diffusion-maps reveal diurnal changes of intervertebral disc composition: an in vivo MRI study at 1. 5 Tesla. J of Magn Reson Imaging. 2008;28:252–7. - PubMed
-
- Roberts N, Hogg D, Whitehouse GH, Dangerfield P. Quantitative analysis of diurnal variation in volume and water content of lumbar intervertebral discs. Clin Anat. 1998;11:1–8. - PubMed
-
- Sivan S, Neidlinger-Wilke C, Würtz K, Maroudas A, Urban JP. Diurnal fluid expression and activity of intervertebral disc cells. Biorheology. 2006;43:283–91. - PubMed
-
- Wuertz K, Urban JP, Klasen J, Ignatius A, Wilke HJ, Claes L, Neidlinger-Wilke C. Influence of extracellular osmolarity and mechanical stimulation on gene expression of intervertebral disc cells. J Ortho Res. 2007;25:1513–22. - PubMed
MeSH terms
Substances
Grants and funding
LinkOut - more resources
Full Text Sources
Other Literature Sources
Research Materials
Miscellaneous
