

FPGA-based RF interference reduction techniques for simultaneous PET-MRI
- PMID: 27049898
- PMCID: PMC5362065
- DOI: 10.1088/0031-9155/61/9/3500
FPGA-based RF interference reduction techniques for simultaneous PET-MRI
Abstract
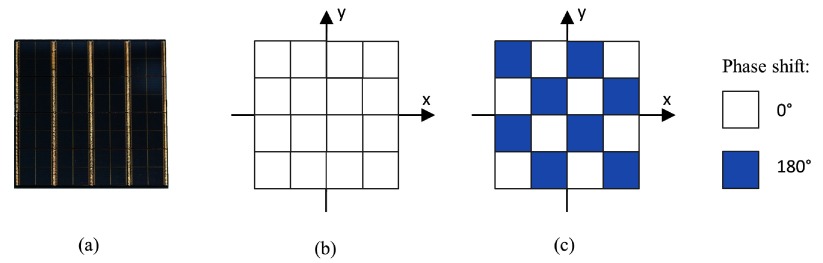
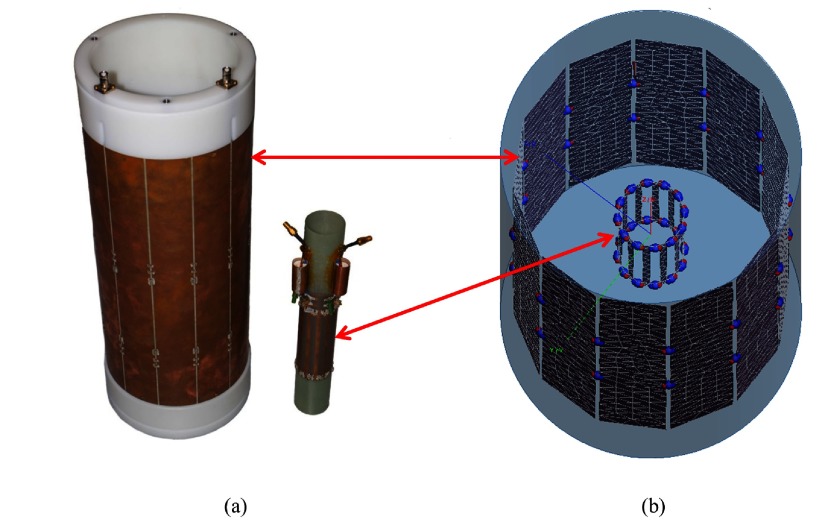
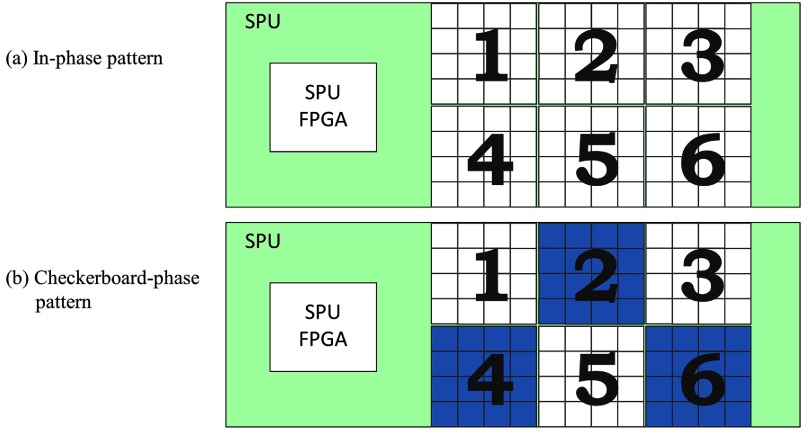
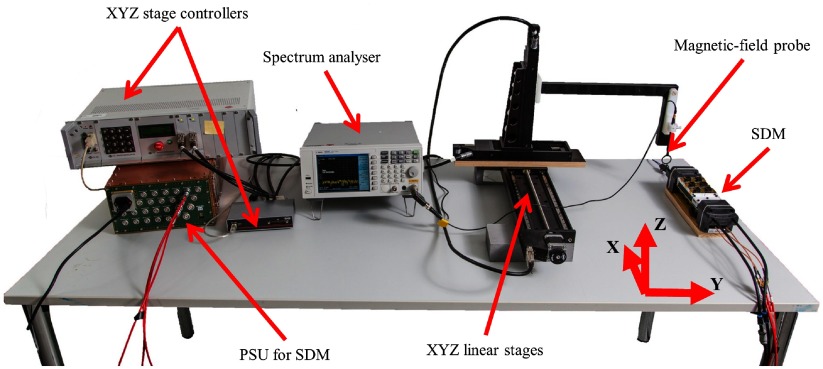
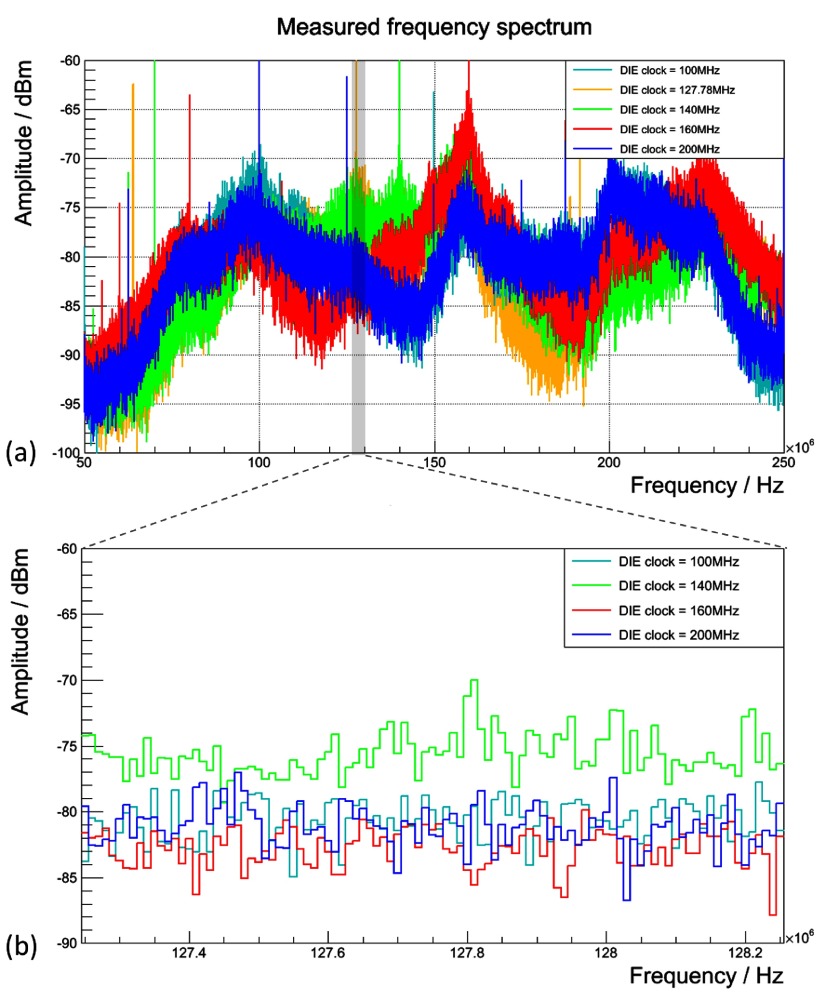
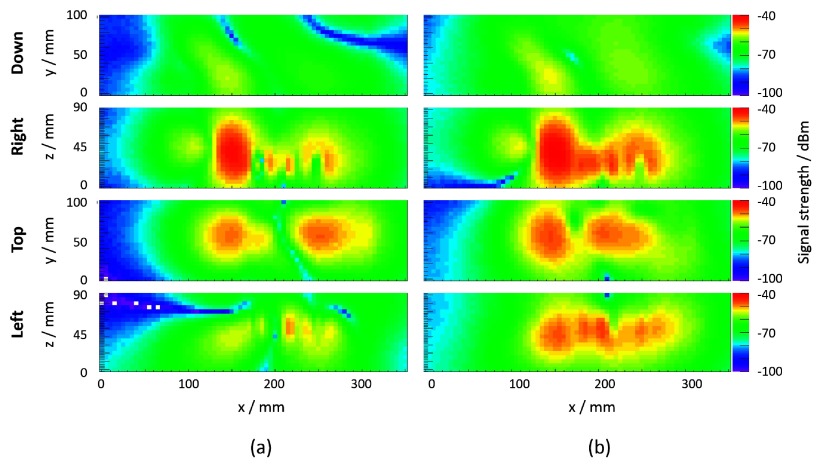
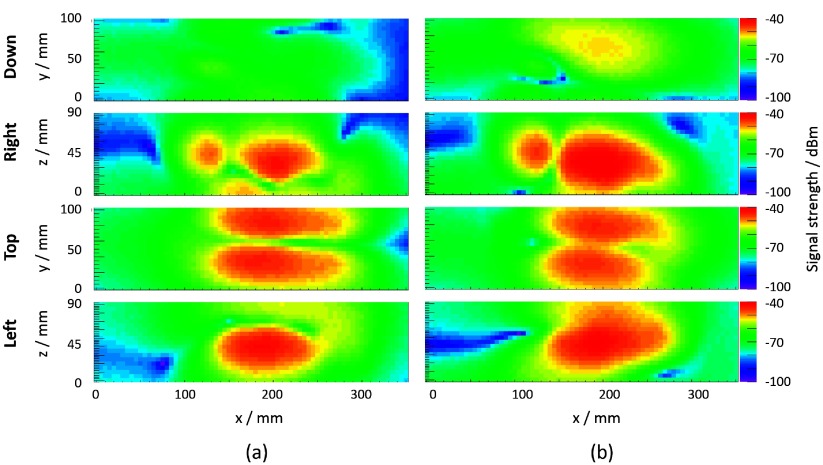
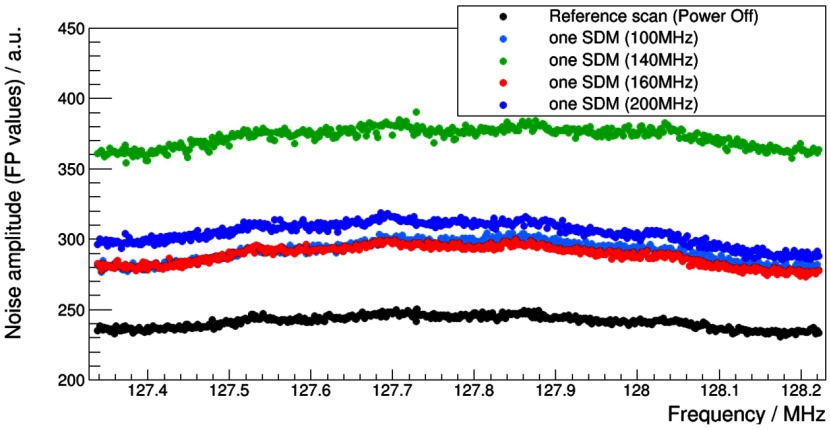
The combination of positron emission tomography (PET) and magnetic resonance imaging (MRI) as a multi-modal imaging technique is considered very promising and powerful with regard to in vivo disease progression examination, therapy response monitoring and drug development. However, PET-MRI system design enabling simultaneous operation with unaffected intrinsic performance of both modalities is challenging. As one of the major issues, both the PET detectors and the MRI radio-frequency (RF) subsystem are exposed to electromagnetic (EM) interference, which may lead to PET and MRI signal-to-noise ratio (SNR) deteriorations. Early digitization of electronic PET signals within the MRI bore helps to preserve PET SNR, but occurs at the expense of increased amount of PET electronics inside the MRI and associated RF field emissions. This raises the likelihood of PET-related MRI interference by coupling into the MRI RF coil unwanted spurious signals considered as RF noise, as it degrades MRI SNR and results in MR image artefacts. RF shielding of PET detectors is a commonly used technique to reduce PET-related RF interferences, but can introduce eddy-current-related MRI disturbances and hinder the highest system integration. In this paper, we present RF interference reduction methods which rely on EM field coupling-decoupling principles of RF receive coils rather than suppressing emitted fields. By modifying clock frequencies and changing clock phase relations of digital circuits, the resulting RF field emission is optimised with regard to a lower field coupling into the MRI RF coil, thereby increasing the RF silence of PET detectors. Our methods are demonstrated by performing FPGA-based clock frequency and phase shifting of digital silicon photo-multipliers (dSiPMs) used in the PET modules of our MR-compatible Hyperion II (D) PET insert. We present simulations and magnetic-field map scans visualising the impact of altered clock phase pattern on the spatial RF field distribution, followed by MRI noise and SNR scans performed with an operating PET module using different clock frequencies and phase patterns. The methods were implemented via firmware design changes without any hardware modifications. This introduces new means of flexibility by enabling adaptive RF interference reduction optimisations in the field, e.g. when using a PET insert with different MRI systems or when different MRI RF coil types are to be operated with the same PET detector.
Figures

Similar articles
-
Study of compatibility between a 3T MR system and detector modules for a second-generation RF-penetrable TOF-PET insert for simultaneous PET/MRI.Med Phys. 2023 Jun;50(6):3389-3400. doi: 10.1002/mp.16354. Epub 2023 Apr 7. Med Phys. 2023. PMID: 36912373
-
Study on the radiofrequency transparency of electrically floating and ground PET inserts in a 3 T clinical MRI system.Med Phys. 2022 May;49(5):2965-2978. doi: 10.1002/mp.15588. Epub 2022 Mar 15. Med Phys. 2022. PMID: 35271749
-
Simultaneous PET/MR imaging with a radio frequency-penetrable PET insert.Med Phys. 2017 Jan;44(1):112-120. doi: 10.1002/mp.12031. Med Phys. 2017. PMID: 28102949 Free PMC article.
-
MRI Coil Development Strategies for Hybrid MR-PET Systems: A Review.IEEE Rev Biomed Eng. 2024;17:342-350. doi: 10.1109/RBME.2022.3227337. Epub 2024 Jan 12. IEEE Rev Biomed Eng. 2024. PMID: 37015609 Review.
-
Hybrid Positron Emission Tomography/Magnetic Resonance Imaging: Challenges, Methods, and State of the Art of Hardware Component Attenuation Correction.Invest Radiol. 2016 Oct;51(10):624-34. doi: 10.1097/RLI.0000000000000289. Invest Radiol. 2016. PMID: 27175550 Review.
Cited by
-
Evaluation of the radiofrequency performance of a wide-bore 1.5 T positron emission tomography/magnetic resonance imaging body coil for radiotherapy planning.Phys Imaging Radiat Oncol. 2020 Dec 23;17:13-19. doi: 10.1016/j.phro.2020.12.002. eCollection 2021 Jan. Phys Imaging Radiat Oncol. 2020. PMID: 33898772 Free PMC article.
-
SAFIR-I: Design and Performance of a High-Rate Preclinical PET Insert for MRI.Sensors (Basel). 2021 Oct 23;21(21):7037. doi: 10.3390/s21217037. Sensors (Basel). 2021. PMID: 34770344 Free PMC article.
-
PET/MRI: a frontier in era of complementary hybrid imaging.Eur J Hybrid Imaging. 2018;2(1):12. doi: 10.1186/s41824-018-0030-6. Epub 2018 Jun 25. Eur J Hybrid Imaging. 2018. PMID: 29998214 Free PMC article. Review.
-
Open Source 3D Multipurpose Measurement System with Submillimetre Fidelity and First Application in Magnetic Resonance.Sci Rep. 2017 Oct 18;7(1):13452. doi: 10.1038/s41598-017-13824-z. Sci Rep. 2017. PMID: 29044156 Free PMC article.
References
-
- Beyer T, et al. A combined PET/CT scanner for clinical oncology. J. Nucl. Med. 2000;41:1369–79. - PubMed
-
- Buerger C, Tsoumpas C, Aitken A, King A, Schleyer P, Schulz V, Marsden P, Schaeffter T. Investigation of MR-based attenuation correction and motion compensation for hybrid PET/MR. IEEE Trans. Nucl. Sci. 2012;19:1967–76. doi: 10.1109/TNS.2012.2209127. - DOI
Publication types
MeSH terms
Grants and funding
LinkOut - more resources
Full Text Sources
Other Literature Sources
Medical
Research Materials