. 2016 Apr 14;532(7598):255-8.
doi: 10.1038/nature17393. Epub 2016 Apr 6.

Reductive carboxylation supports redox homeostasis during anchorage-independent growth

Affiliations

Reductive carboxylation supports redox homeostasis during anchorage-independent growth

Lei Jiang et al. Nature. .

Abstract

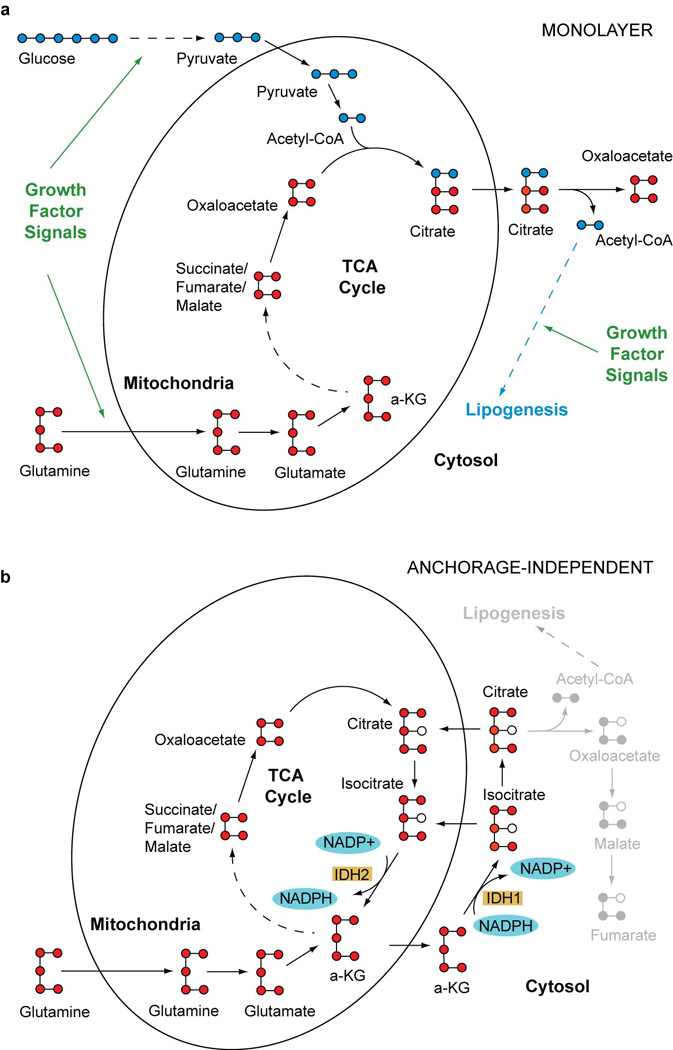
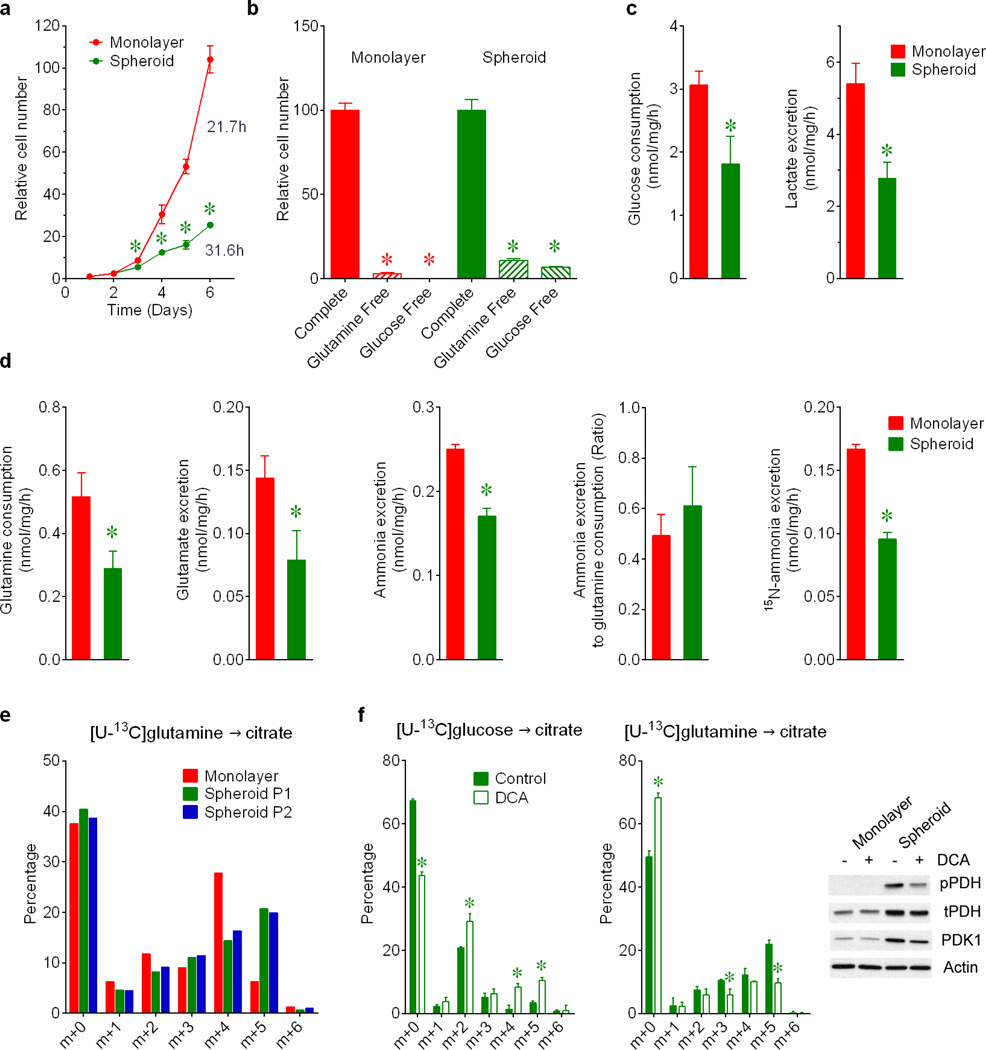
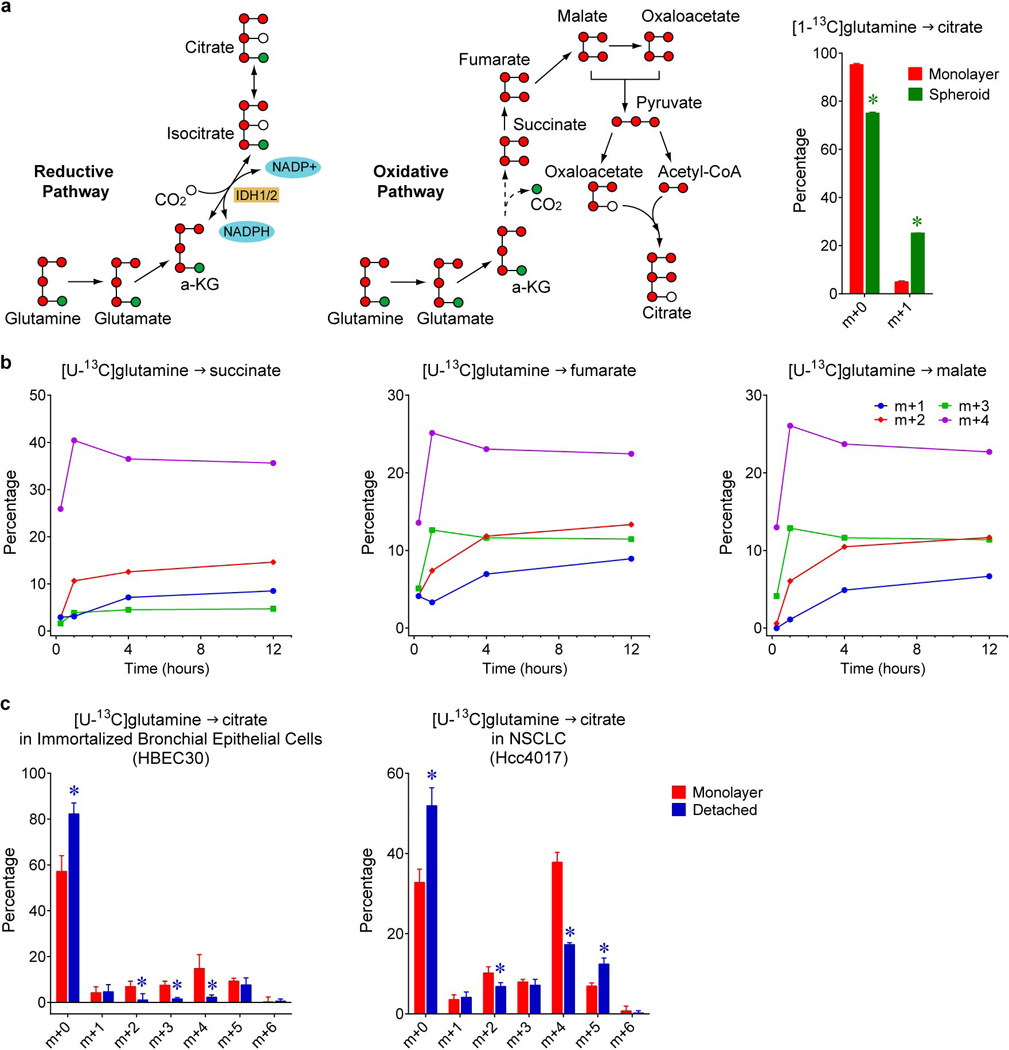
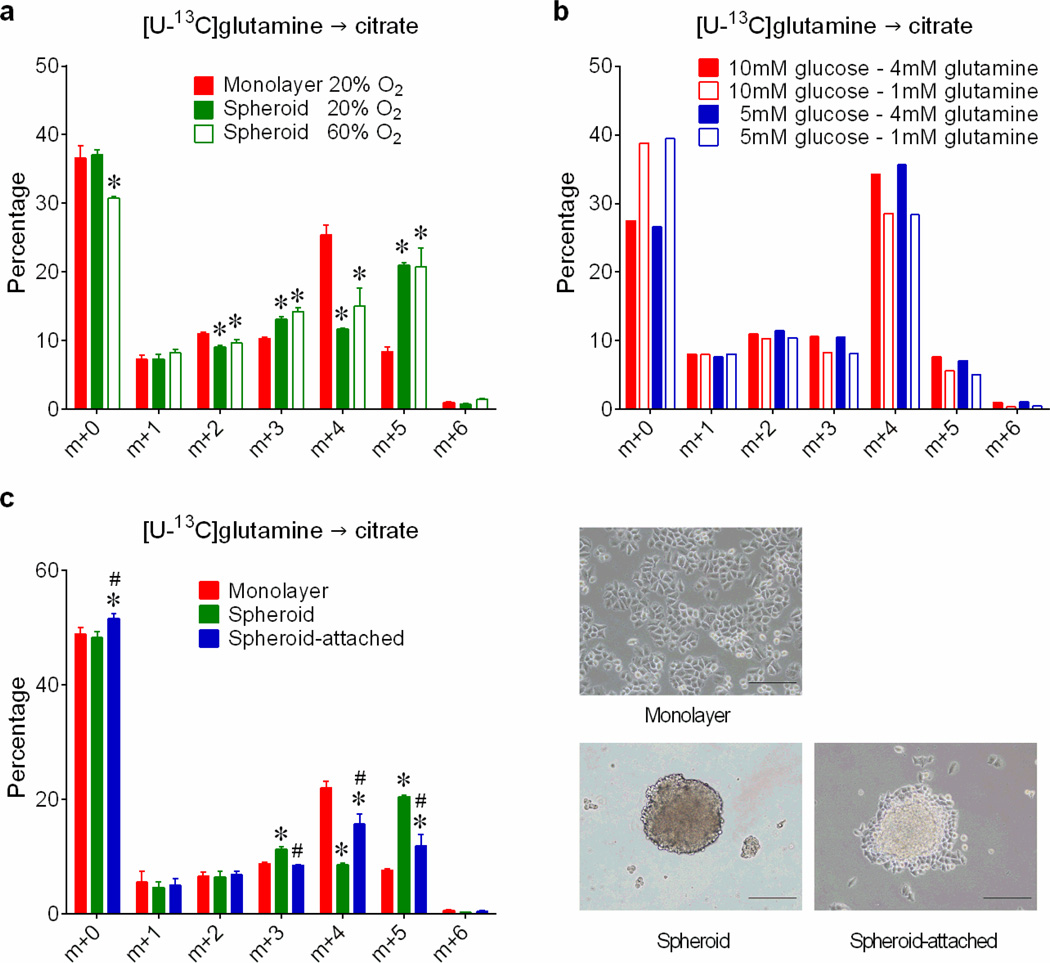
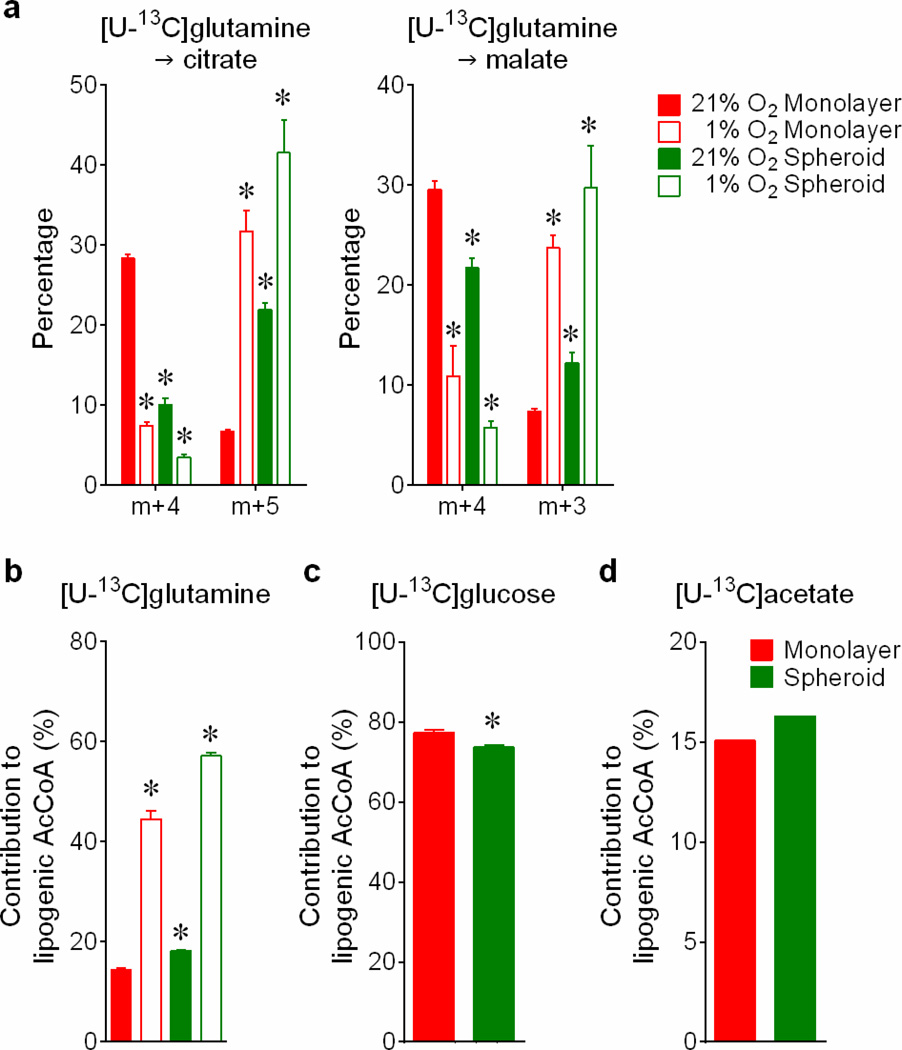
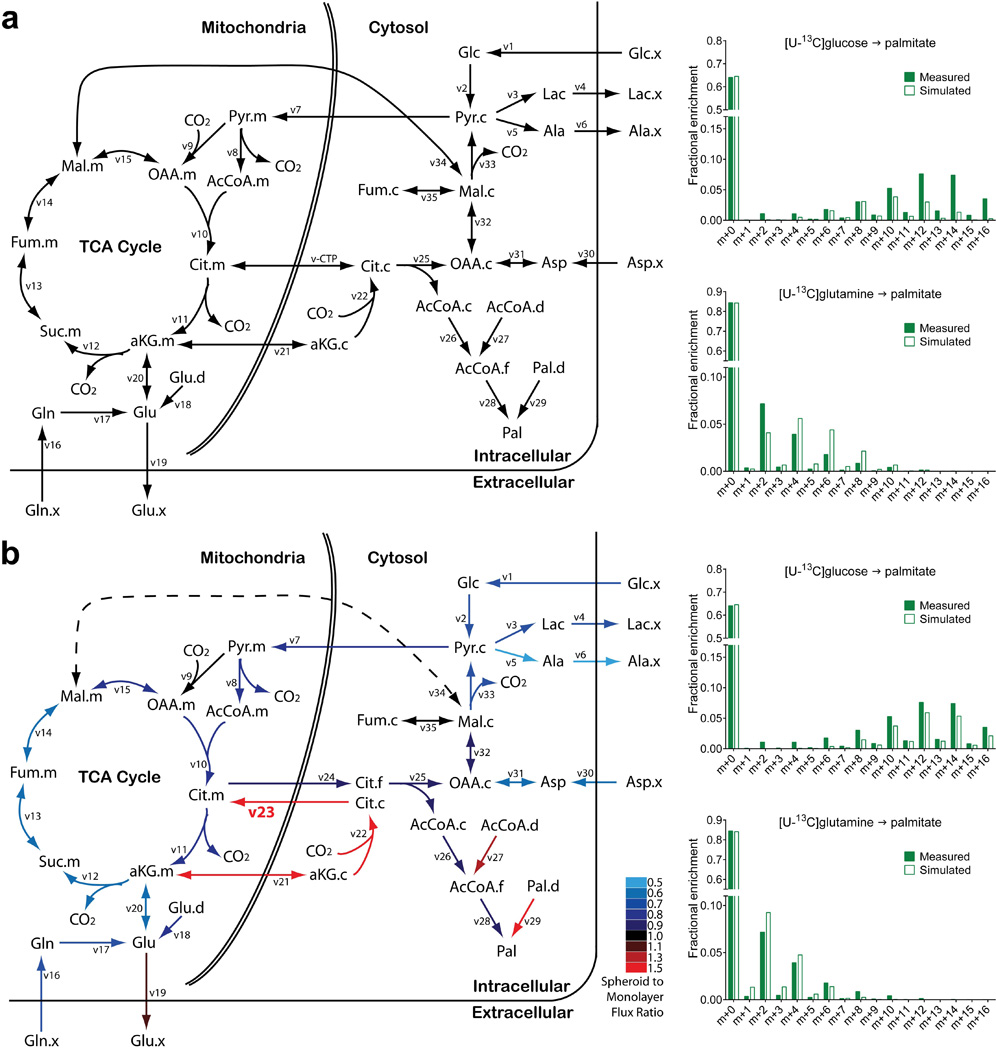
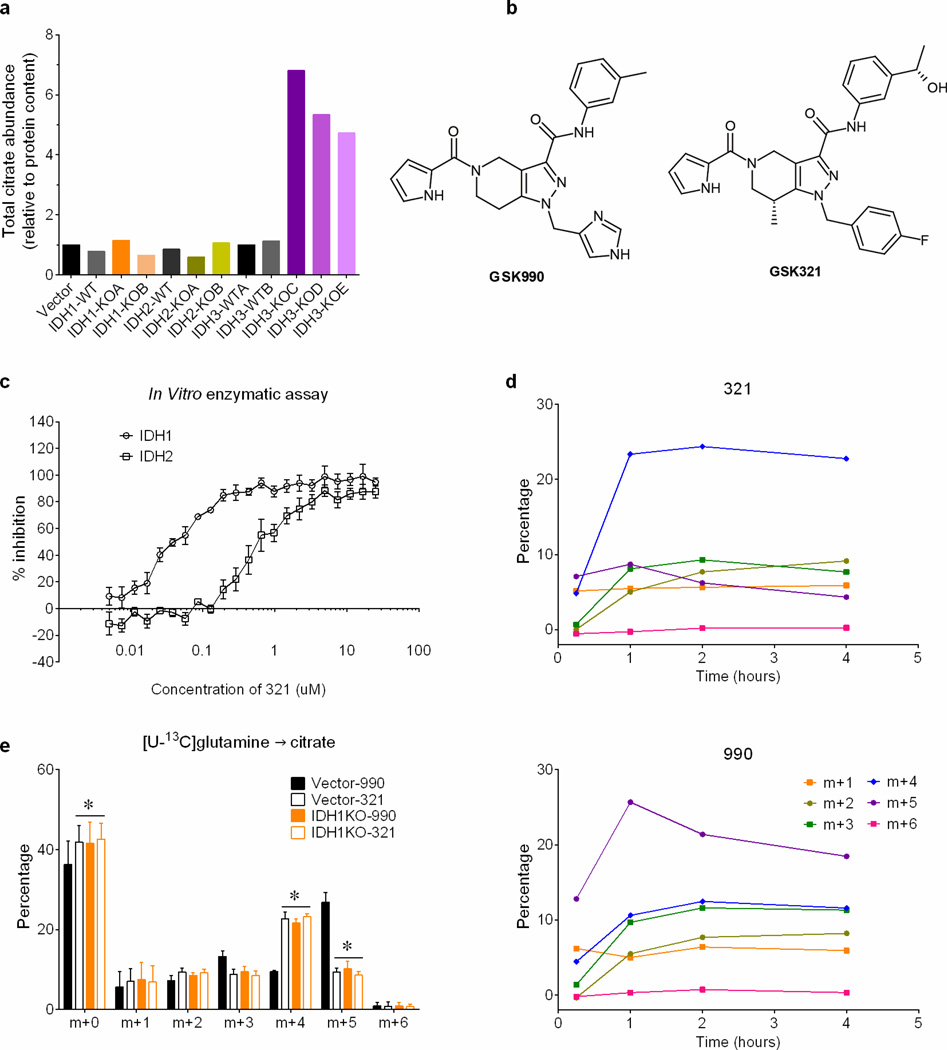
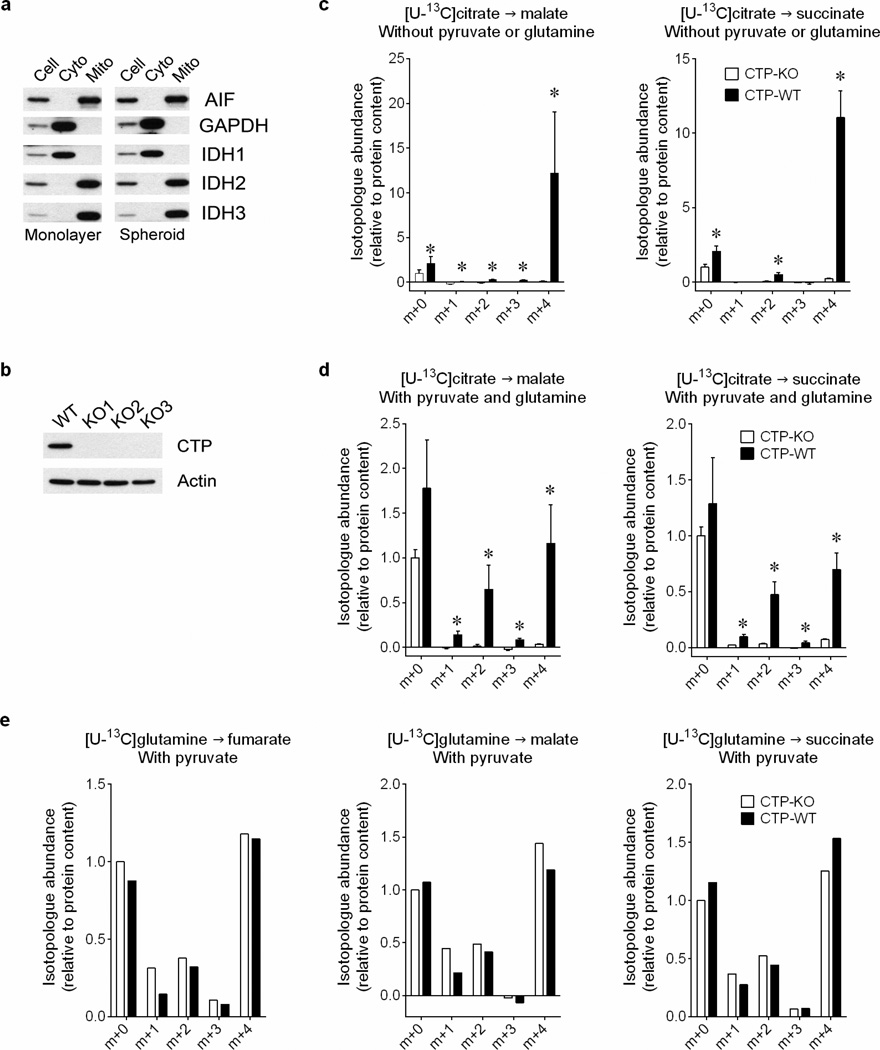
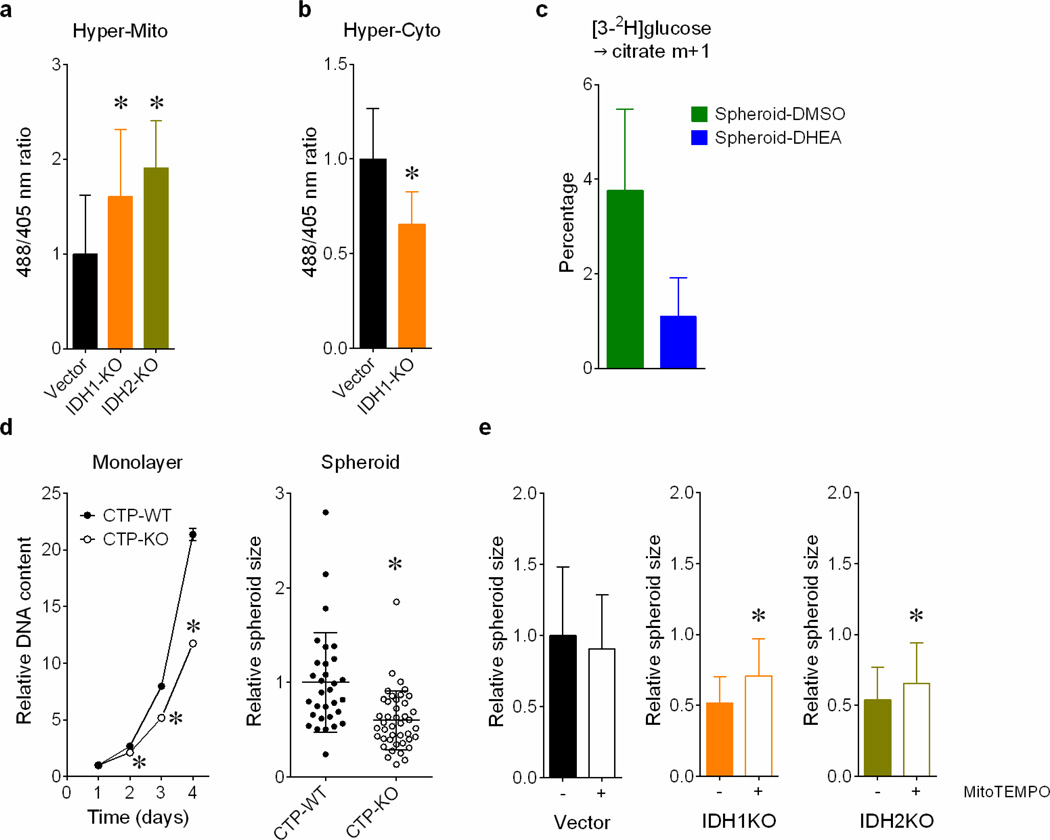
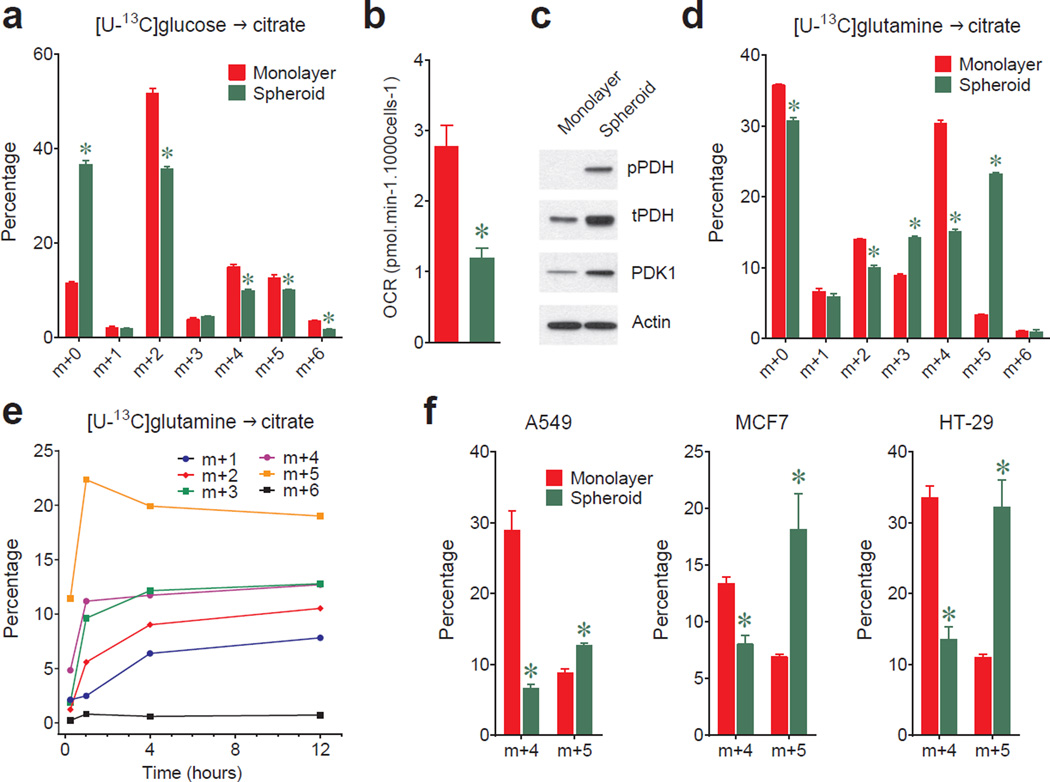
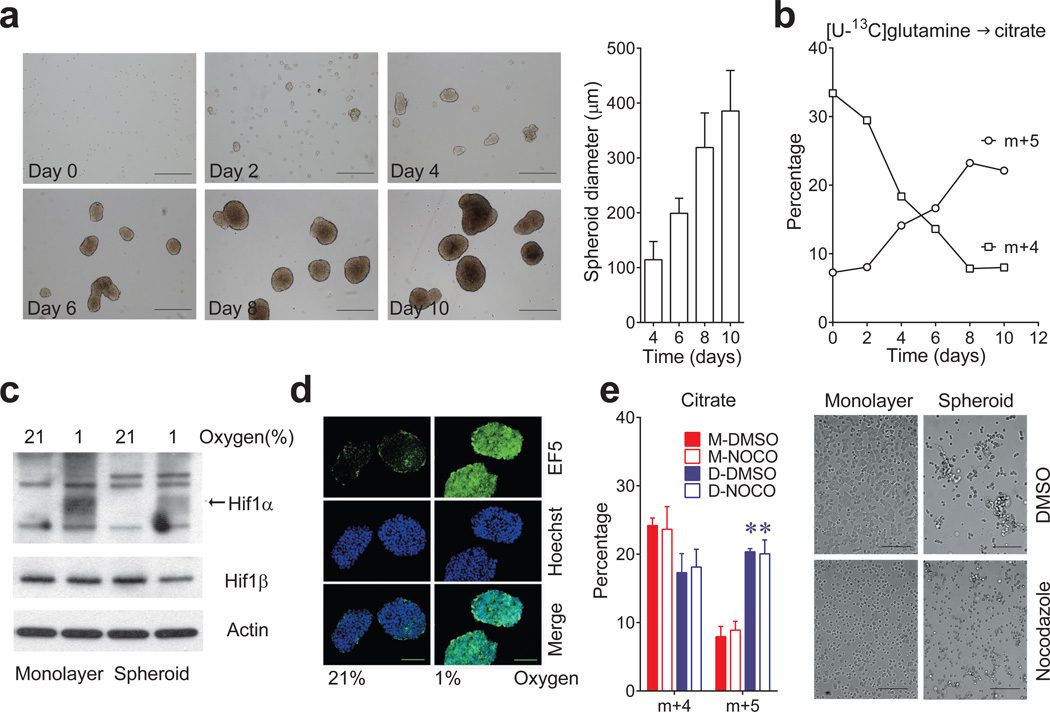
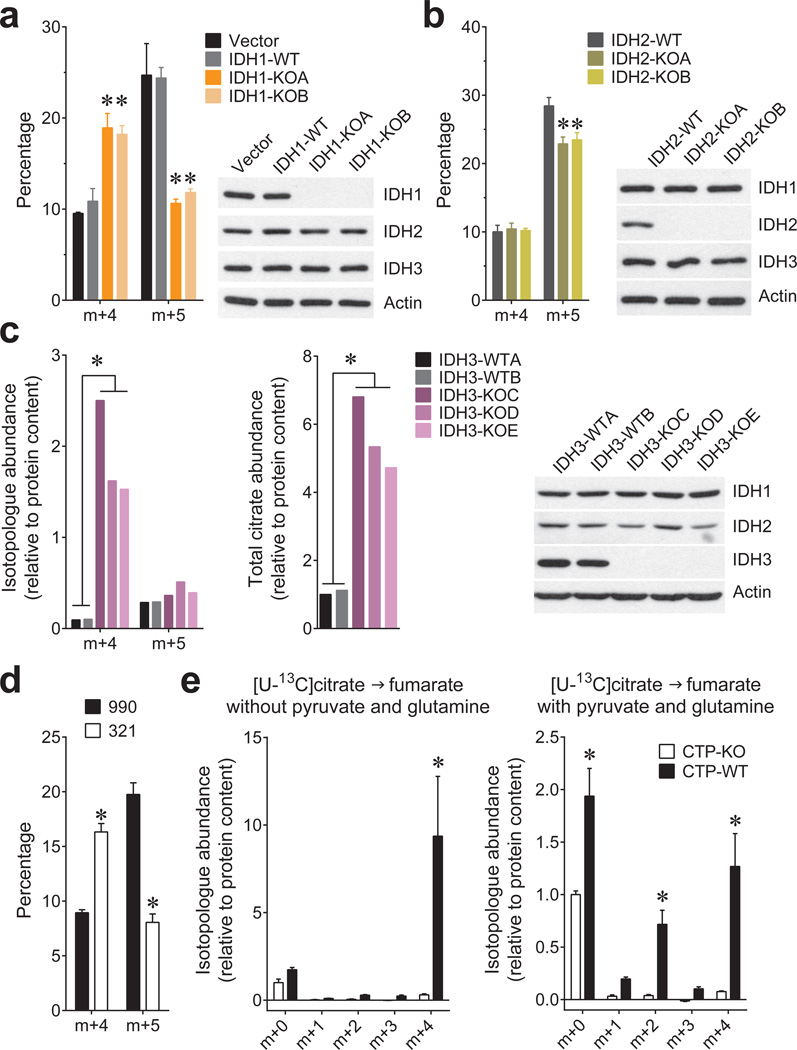
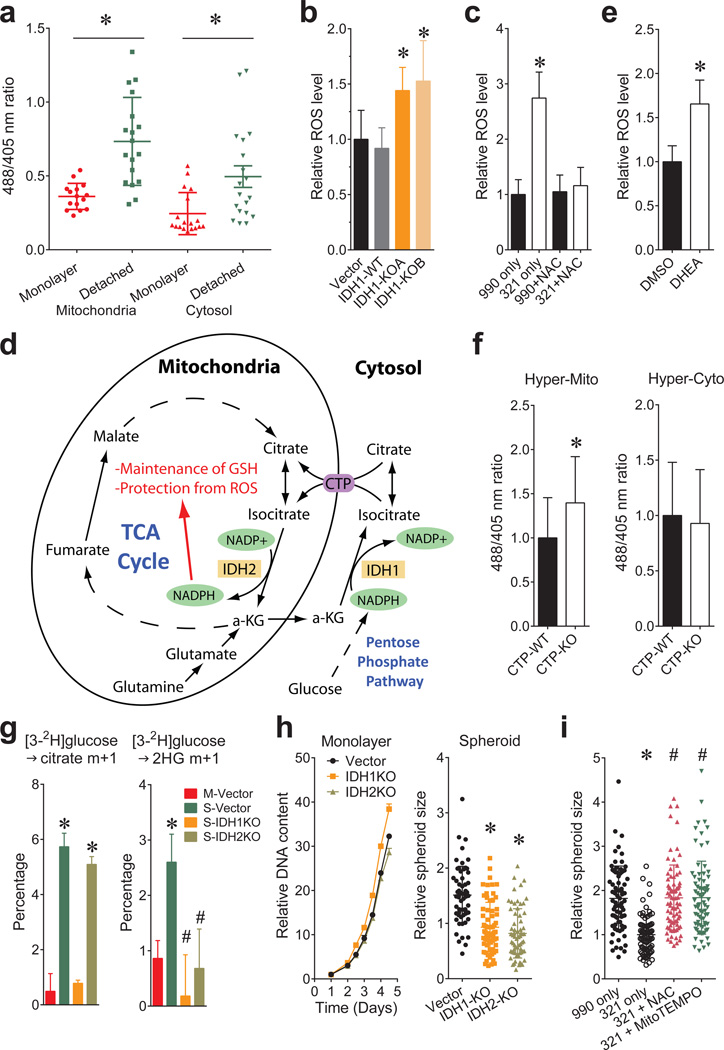
Cells receive growth and survival stimuli through their attachment to an extracellular matrix (ECM). Overcoming the addiction to ECM-induced signals is required for anchorage-independent growth, a property of most malignant cells. Detachment from ECM is associated with enhanced production of reactive oxygen species (ROS) owing to altered glucose metabolism. Here we identify an unconventional pathway that supports redox homeostasis and growth during adaptation to anchorage independence. We observed that detachment from monolayer culture and growth as anchorage-independent tumour spheroids was accompanied by changes in both glucose and glutamine metabolism. Specifically, oxidation of both nutrients was suppressed in spheroids, whereas reductive formation of citrate from glutamine was enhanced. Reductive glutamine metabolism was highly dependent on cytosolic isocitrate dehydrogenase-1 (IDH1), because the activity was suppressed in cells homozygous null for IDH1 or treated with an IDH1 inhibitor. This activity occurred in absence of hypoxia, a well-known inducer of reductive metabolism. Rather, IDH1 mitigated mitochondrial ROS in spheroids, and suppressing IDH1 reduced spheroid growth through a mechanism requiring mitochondrial ROS. Isotope tracing revealed that in spheroids, isocitrate/citrate produced reductively in the cytosol could enter the mitochondria and participate in oxidative metabolism, including oxidation by IDH2. This generates NADPH in the mitochondria, enabling cells to mitigate mitochondrial ROS and maximize growth. Neither IDH1 nor IDH2 was necessary for monolayer growth, but deleting either one enhanced mitochondrial ROS and reduced spheroid size, as did deletion of the mitochondrial citrate transporter protein. Together, the data indicate that adaptation to anchorage independence requires a fundamental change in citrate metabolism, initiated by IDH1-dependent reductive carboxylation and culminating in suppression of mitochondrial ROS.


Figures

Extended Data Figure 1
Extended Data Figure 1. Alternative pathways of isocitrate/citrate metabolism
a, Predominant path of citrate formation in monolayer culture. b, Proposed pathway in anchorage-independent culture, emphasizing an alternative route of isocitrate/citrate metabolism and reducing equivalent flow.
Extended Data Figure 2
Extended Data Figure 2. Nutrient metabolism in H460 spheroid culture
a, Cell proliferation and doubling times of H460 cells cultured under monolayer and spheroid conditions (n=4 cultures days 1–4; n=3 cultures days 5–6). b, Effect of glucose or glutamine deprivation on cell counts in monolayer and spheroid culture (n=4 cultures from a representative experiment). c, Rates of glucose consumption and lactate excretion in monolayer and spheroid culture (n=4 cultures from two experiments). d, Rates of glutamine consumption; glutamate and ammonia excretion; ratio of ammonia excretion to glutamine consumption; and rate of excretion of 15NH4+ originating from [γ-15N]glutamine in monolayer and spheroid culture (n=3 cultures from a representative experiment). e, Citrate mass isotoplogue analysis in H460 cells in monolayer culture, aggregated into spheroids (P1), or disaggregated from spheroids then permitted to re-aggregate (P2) (n=2 cultures from a representative experiment). f, Right, protein levels of phosphorylated PDHα (pPDH, Ser293), total PDHα (tPDH) and PDK1 in monolayer and spheroid culture with or without 2mM dichloroacetate (DCA). Left, citrate mass isotopologue analysis in H460 spheroids cultured with [U-13C]glucose or [U-13C]glutamine, and treated with 2mM DCA (n=3 cultures from a representative experiment). *p<0.05, Welch's unequal variances t-test (a, c, d and f), or Welch's unequal variances t-test, followed by multiple-comparison correction (b). All experiments were repeated 3 times or more.
Extended Data Figure 3
Extended Data Figure 3. Reductive citrate metabolism in anchorage-independent spheroid culture
a, Citrate m+5 may be generated in several ways from [U-13C]glutamine, including through reductive (left) or oxidative (middle) pathways. To test whether citrate m+5 arises from oxidative or reductive metabolism, spheroids were cultured with [1-13C]glutamine. Glutamine-C1 (green circle) is released as CO2 by α-ketoglutarate dehydrogenase in the oxidative TCA cycle, but is transferred to citrate via reductive metabolism. Citrate mass isotopologues in H460 cells cultured with [1-13C]glutamine (right). The m+1 fraction in this experiment is comparable to the m+5 fraction from [U-13C]glutamine (~20%), indicating that reductive labeling was enhanced in spheroids (n=3 cultures from a representative experiment). b, Time-dependent evolution of succinate, fumarate and malate mass isotopologues in spheroids cultured with [U-13C]glutamine (n=2 cultures for each time point). c, Citrate labeling from [U-13C]glutamine in immortalized, non-transformed bronchial epithelial cells (HBEC30) and lung cancer cells (HCC4017) from the same patient (n=3 cultures from two experiments). *p<0.05, Welch's unequal variances t-test. All experiments were repeated 3 times or more.
Extended Data Figure 4
Extended Data Figure 4. Effect of oxygen availability, nutrient availability and anchorage on reductive carboxylation
a, Mass isotopologues of citrate in spheroids cultured with [U-13C]glutamine under 20% and 60% oxygen (n=4 cultures from two experiments). b, Effects of reducing extracellular glucose and glutamine concentrations on citrate mass isotopologues in monolayer cells cultured with [U-13C]glutamine (n=2 cultures from a representative experiment). c, Day 7 spheroids were allowed to attach to a conventional tissue culture dish for 24h, and mass isotopologues of citrate were analyzed with [U-13C]glutamine tracing (n=4 cultures from two experiments). Insets are photomicrographs of cells in each of the culture conditions. Scale bars, 200 µm. *p<0.05 comparing to monolayer, #p<0.05 comparing to spheroid, Welch's unequal variances t-test followed by multiple-comparison correction. All experiments were repeated 3 times or more.
Extended Data Figure 5
Extended Data Figure 5. Hypoxia and anchorage independence elicit different effects on citrate metabolism
a, Mass isotopologues of citrate and malate in H460 cells cultured with [U-13C]glutamine, in monolayer or spheroid conditions, under 21% or 1% oxygen (n=4 cultures from two experiments). Contribution of glutamine (b), glucose (c) and acetate (d) to the lipogenic acetyl-CoA pool used for palmitate synthesis, during 24h of culture with each tracer (n=3 cultures in panels b and c; n=2 cultures in panel d from a representative experiment). *p<0.05, Welch's unequal variances t-test followed by multiple-comparison correction (a), or ANOVA (b), or Welch's unequal variances t-test (c). The experiment in d was repeated twice, and all other experiments were repeated 3 times or more.
Extended Data Figure 6
Extended Data Figure 6. Graphical view of metabolic flux analysis (MFA)
a, A conventional set of metabolic reactions and compartmentation produced an inadequate fit with the experimental data, with an unacceptable sum-of-squared residuals (SSR=336). Poorly fit palmitate isotopologues from [U-13C]glucose and [U-13C]glutamine are shown on the right. v-CTP, bidirectional isocitrate/citrate trafficking flux. b, In the modified metabolic network, isocitrate/citrate produced from cytosolic reductive carboxylation enters the mitochondria and mixes with the isocitrate/citrate pool there. Adding this new reaction to the model (indicated in bold as v23) substantially improved the overall fit (SSR=179) and the fit with palmitate isotopologues (right). Color coding in b reflects flux changes in spheroids, expressed as the ratio of spheroid flux/monolayer flux. The dashed line indicates that the overall direction of malate transport was predicted to reverse from mitochondrial efflux in monolayer cells to mitochondrial import in spheroids. Flux terms are defined in Supplementary Table 2, and abbreviations and quantitative flux rates are in Extended Data Table 1.
Extended Data Figure 7
Extended Data Figure 7. IDH1 inhibition suppresses reductive carboxylation in spheroids
a, Abundance of citrate in vector control, wild-type, and IDH1, IDH2 or IDH3-deficient spheroids (n=2 cultures from a representative experiment). b, Structure of IDH1 inhibitor compound GSK321 and structurally similar control compound GSK990. Compound GSK321 was initially identified as a potent inhibitor against an oncogenic allele of IDH1 containing the R132H mutation. Subsequent analysis revealed that at higher doses, the compound also inhibits wild-type IDH1. c, In vitro activity assay revealing effects of compound 321 on enzymatic activity of recombinant wild-type IDH1 and IDH2 (n=4 repeats from a representative experiment). d, Time-dependent evolution of citrate mass isotopologues in 990- or 321-treated spheroids cultured with [U-13C]glutamine (n=1 culture for each time point). e, Mass isotopologues of citrate in vector control and IDH1KO spheroids cultured with [U-13C]glutamine and treated with 5µM IDH1 inhibitor (321) or control compound (990) (n=4 cultures from two experiments). *p<0.05, ANOVA. Experiments in d were repeated twice, and experiments in c and e were repeated 3 times or more.
Extended Data Figure 8
Extended Data Figure 8. Mitochondria take up and metabolize citrate
a, Protein expression of mitochondrial and cytosolic markers in subcellular fractions of monolayer and spheroid culture. b, Protein expression of CTP in control and CTP-deficient H460 cells. c, Mass isotopologues of malate and succinate in isolated mitochondria cultured with [U-13C]citrate (n=4 cultures from two experiments). d, Mass isotopologues of malate and succinate in isolated mitochondria cultured with [U-13C]citrate, unlabeled pyruvate and glutamine (n=4 cultures from two experiments). e, Mass isotopologues of fumarate, malate and succinate in isolated mitochondria cultured with [U-13C]glutamine and unlabeled pyruvate (n=2 cultures from a representative experiment). *p<0.05, Welch's unequal variances t-test. Experiments in e were repeated twice, and all other experiments were repeated 3 times or more.
Extended Data Figure 9
Extended Data Figure 9. Reductive glutamine metabolism mitigates mitochondrial ROS and promotes spheroid growth
Mitochondrial (a) and cytosolic (b) ROS detected by a genetic hydrogen peroxide sensor in H460 spheroids containing or lacking IDH1 or IDH2. (n=29 Vector spheroids; n=26 IDH1-KO and IDH2-KO spheroids in panel a; n=23 Vector spheroids; n=22 IDH1-KO spheroids in panel b). c, Deuterium labeling of citrate in H460 spheroids without and with the pentose phosphate pathway inhibitor DHEA (n=3 cultures from a representative experiment). d, Growth of H460 cells containing or lacking CTP in monolayer conditions (left) and as spheroids (right) (n=6 monolayer cultures; n=31 CTP-WT spheroids; n=42 CTP-KO spheroids). e, Size of H460 spheroids containing or lacking IDH1 or IDH2, and treated with or without the mitochondrial ROS scavenger MitoTEMPO. (n=40 Vector “−” spheroids; n=52 Vector “+” spheroids; n=46 IDH1KO “−“ and “+” spheroids; n=48 IDH2KO “−” spheroids; n=52 IDH2KO “+” spheroids). *p<0.05, ANOVA (a), or Welch's unequal variances t-test (b–e). All experiments were repeated 3 times or more.
Figure 1
Figure 1. Reductive glutamine metabolism in spheroids
a, Mass isotopolgue analysis of citrate in H460 cells cultured with [U-13C]glucose and unlabeled glutamine (n=3 cultures from a representative experiment). b, Oxygen consumption rates (OCR) of cells grown in monolayer or spheroid culture (n=10 monolayer cultures and 11 spheroids from a representative experiment). c, Western blot for total (t) and phosphorylated (p, Ser293) PDH, and PDH kinase-1 (PDK1). d, Mass isotopologue analysis of citrate in cells cultured with [U-13C]glutamine and unlabeled glucose (n=3 cultures from a representative experiment). e, Evolution of citrate mass isotopologues in spheroids cultured with [U-13C]glutamine (n=2 cultures for each time point). f, Citrate m+4 and m+5 isotopologues in monolayer and spheroid cultures of A549, HT-29 and MCF7 cells cultured with [U-13C]glutamine (n=3 A549 monolayer cultures; n=4 cultures for all other conditions). Complete mass isotopologue distributions are in Supplementary Table 1. *p<0.05, Welch's unequal variances t-test. All experiments were repeated 3 times or more.
Figure 2
Figure 2. Spheroid metabolism is distinct from the metabolic alterations induced by hypoxia
a, Time-dependent increase in H460 spheroid diameter. Scale bars, 500 µm. (n=20 spheroids on days 4 and 6; n=18 spheroids on day 8; n=16 spheroids on day 10). b, Citrate isotopologues in spheroids cultured for 4h with [U-13C]glutamine and unlabeled glucose (n=2 cultures for each time point). c, Effect of hypoxia on HIF1α protein expression in monolayer and spheroid culture. HIF1α protein is indicated by an arrow, with nonspecific bands also present on the blot. d, EF5 staining in sectioned spheroids cultured under 21% or 1% oxygen for 16 hours. Scale bars, 100 µm. e, Citrate m+4 and m+5 isotopologues in monolayer (M) or detached (D) H460 cells labeled with [U-13C]glutamine and treated with DMSO or nocodazole (NOCO) to prevent aggregation (n=4 cultures from two experiments). Scale bars, 200 µm. *p<0.05, Welch's unequal variances t-test followed by multiple-comparison correction. Experiments in a and b were repeated twice. Experiments in c, d and e were repeated 3 times or more.
Figure 3
Figure 3. Reductive carboxylation in spheroids is primarily dependent on cytosolic IDH1
Fractional abundance of citrate m+4 and m+5 in spheroids containing or lacking IDH1 (a) or IDH2 (b) cultured in [U-13C]glutamine (n=3 cultures from two experiments). c, Abundance of total citrate and of citrate m+4 and m+5 from [U-13C]glutamine in H460 spheroids containing or lacking IDH3 (n=2 cultures from a representative experiment). d, Fractional abundance of citrate m+4 and m+5 in H460 spheroids cultured with [U-13C]glutamine and treated with an IDH1 inhibitor (321) or a structurally similar control compound (990) (n=4 cultures from two experiments). e, Fumarate mass isotopologues in mitochondria isolated from cells containing or lacking the citrate transporter protein (CTP-WT and CTP-KO, respectively). Isolated mitochondria were cultured with [U-13C]citrate as the sole carbon source (left), or [U-13C]citrate with unlabeled pyruvate and glutamine (right) (n=4 cultures from two experiments). *p<0.05, ANOVA (a–b), or Welch's unequal variances t-test (c–e). All experiments were repeated 3 times or more.
Figure 4
Figure 4. Reductive glutamine metabolism mitigates mitochondrial ROS and promotes spheroid growth
a, Transient expression of mitochondrial and cytosolic hydrogen peroxide reporter (HyPer) vectors in H460 cells. Cells were cultured under monolayer or detached conditions for 48 hours before imaging to assess ROS levels. (n=15 HyperMito monolayer cells; n=18 HyperMito detached cells; n=18 HyperCyto monolayer cells; n=19 HyperCyto detached cells). b, Staining of parental or IDH1-deficient H460 spheroids with the mitochondrial ROS sensor MitoSOX. (n=16 Vector spheroids; n=18 IDH1-WT spheroids; n=17 IDH1-KOA spheroids; n=15 IDH1-KOB spheroids). c, Effect of IDH1 inhibition by compound 321 and the ROS scavenger N-acetylcysteine (NAC) on MitoSOX signal in H460 spheroids. (n=31 990 only spheroids; n=25 321 only spheroids; n=33 990+NAC spheroids; n=30 321+NAC spheroids). d, Pathway through which cytosolic reductive carboxylation, followed by isocitrate/citrate import into the mitochondria, can contribute to the mitochondrial NADPH pool and suppress mitochondrial ROS. e, MitoSOX staining of DHEA-treated H460 spheroids (n=53 spheroids for each condition). f, HyPer signal for mitochondrial (left) and cytosolic (right) ROS in H460 cells containing or lacking CTP. (n=28 HyperCyto CTP-KO cells; n=35 cells for all other conditions). g, Labeling from [3-2H]glucose in citrate (left) or 2-HG (right) in H460-derived cells expressing mutant IDH2 and containing or lacking wild type IDH1 and IDH2 (n=3 cultures, *p<0.05, comparing to M-Vector, #p<0.05, comparing to S-Vector). M, monolayer; S, spheroid. h, Monolayer and spheroid growth of H460 cells containing or lacking IDH1 or IDH2. (n=6 monolayer cultures for each cell line; n=59 Vector spheroids; n=70 IDH1-KO spheroids; n=65 IDH2-KO spheroids). i, Spheroid size after 8 days of 321 treatment, with or without NAC or the mitochondrial ROS scavenger MitoTEMPO. (n=75 990 only spheroids; n=77 321 only spheroids; n=81 321+NAC spheroids; n=77 321+MitoTEMPO spheroids, #p<0.05 comparing to treatment with 321 only). *,#p<0.05, ANOVA (b, c, g, h and i), or Welch's unequal variances t-test (a, e and f). Experiment in f were repeated twice, and all other experiments were repeated 3 times or more.

Comment in

References

    1. Bhowmick NA, Neilson EG, Moses HL. Stromal fibroblasts in cancer initiation and progression. Nature. 2004;432:332–337. - PMC - PubMed
    1. Schafer ZT, et al. Antioxidant and oncogene rescue of metabolic defects caused by loss of matrix attachment. Nature. 2009;461:109–113. - PMC - PubMed
    1. Grassian AR, Metallo CM, Coloff JL, Stephanopoulos G, Brugge JS. Erk regulation of pyruvate dehydrogenase flux through PDK4 modulates cell proliferation. Genes & development. 2011;25:1716–1733. - PMC - PubMed
    1. Rajagopalan KN, et al. Metabolic plasticity maintains proliferation in pyruvate dehydrogenase deficient cells. Cancer & metabolism. 2015;3:7. - PMC - PubMed
    1. Kim HS, et al. Systematic identification of molecular subtype-selective vulnerabilities in non-small-cell lung cancer. Cell. 2013;155:552–566. - PMC - PubMed

Publication types

MeSH terms