. 2016 Apr 14;532(7598):201-6.
doi: 10.1038/nature17644. Epub 2016 Apr 6.

Modulation of tissue repair by regeneration enhancer elements

Affiliations

Modulation of tissue repair by regeneration enhancer elements

Junsu Kang et al. Nature. .

Abstract

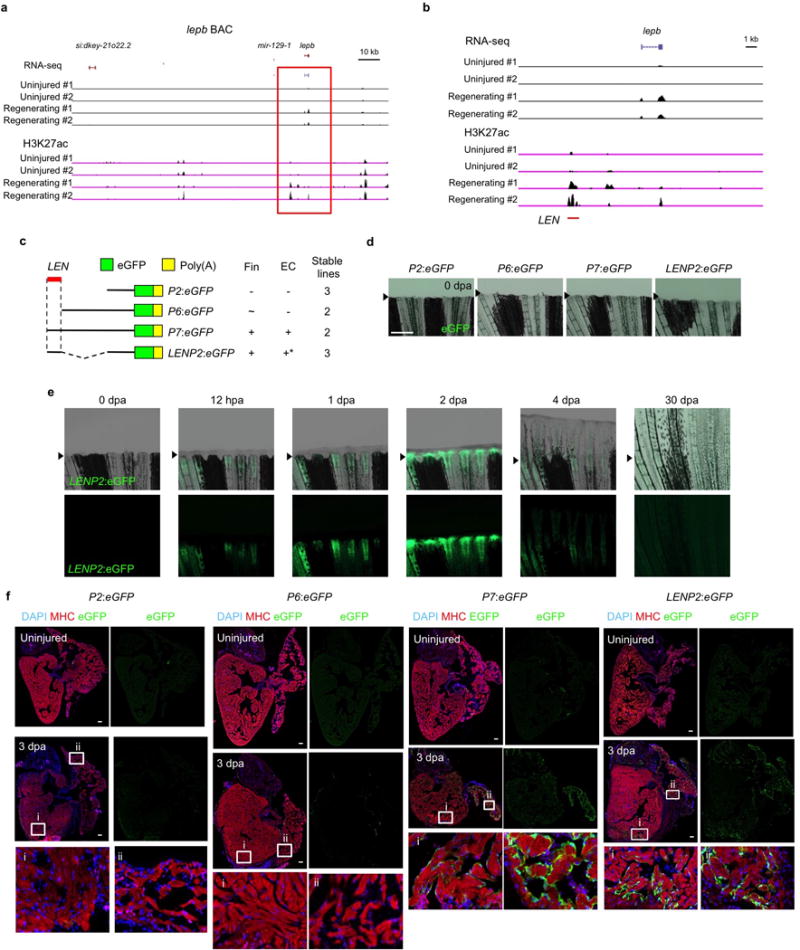
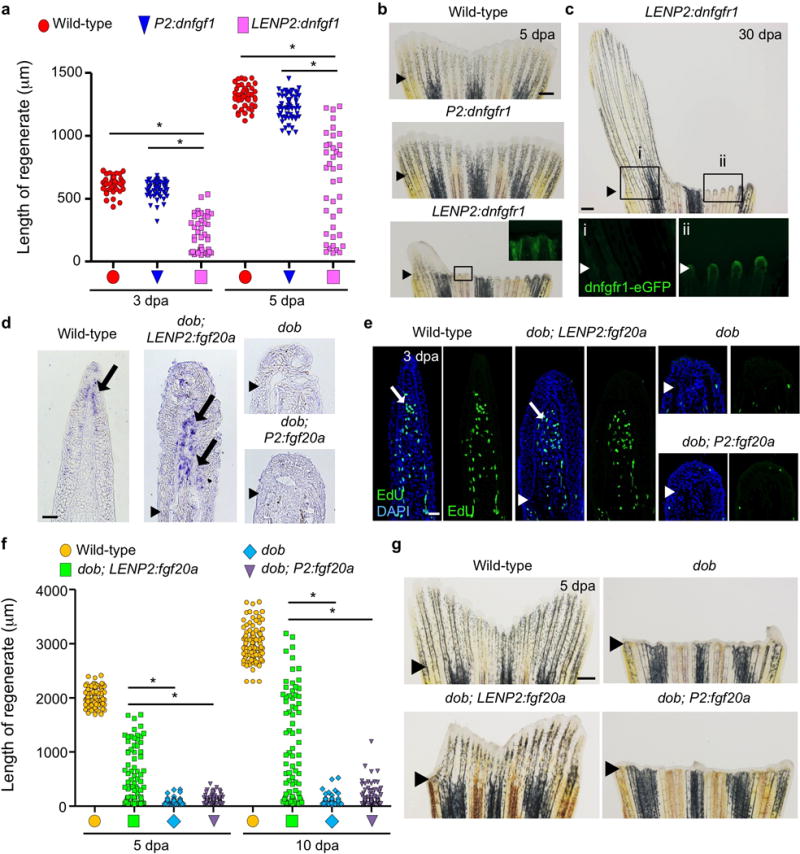
How tissue regeneration programs are triggered by injury has received limited research attention. Here we investigate the existence of enhancer regulatory elements that are activated in regenerating tissue. Transcriptomic analyses reveal that leptin b (lepb) is highly induced in regenerating hearts and fins of zebrafish. Epigenetic profiling identified a short DNA sequence element upstream and distal to lepb that acquires open chromatin marks during regeneration and enables injury-dependent expression from minimal promoters. This element could activate expression in injured neonatal mouse tissues and was divisible into tissue-specific modules sufficient for expression in regenerating zebrafish fins or hearts. Simple enhancer-effector transgenes employing lepb-linked sequences upstream of pro- or anti-regenerative factors controlled the efficacy of regeneration in zebrafish. Our findings provide evidence for 'tissue regeneration enhancer elements' (TREEs) that trigger gene expression in injury sites and can be engineered to modulate the regenerative potential of vertebrate organs.


Conflict of interest statement

The authors declare no competing financial interests. Readers are welcome to comment on the online version of the paper.

Figures

Extended Data Figure 1
Extended Data Figure 1. lepb transcripts are sharply induced during fin and heart regeneration
a, Venn diagram displaying numbers of genes with significantly increased transcript levels during fin and heart regeneration. b, RT-PCR of samples from 2 days post-fertilization (dpf) and 4 dpf embryos, and uninjured and regenerating adult tissues. lepb was not detected during embryogenesis and in uninjured tissues, but induced during regeneration. β-act2 is used as loading control. Uninj, Uninjured. c, (Left) Relative expression of lepb in uninjured, 1, 2, and 4 dpa fin regenerates. lepb transcript levels are increased at 1 and 2 dpa. (Right) Relative expression of lepb in uninjured or 3 dpa cardiac ventricles, assessed by qPCR. d, e, Endogenous lepb expression assessed by in situ hybridization in sections of fins (d) and cardiac ventricle and atrium (e). Arrowhead, amputation plane. Arrows, endocardial lepb expression. Left: uninjured tissues, Right: regenerating tissues. dpa: days post-amputation. f, g, F0 animals, injected with the transgenic lepb:eGFP BAC reporter construct at the one-cell stage, induced eGFP after larval fin fold amputation (f) and during adult fin regeneration (g). Note that lepb:eGFP is mosaically expressed. Arrowheads, amputation planes. h, i, Expression pattern of lepb:eGFP stable transgenic animals. lepb:eGFP was not detected in fin and heart during embryogenesis (h, 2 dpf; i, 4 dpf). Below ‘i’ are enlargements of the boxed areas, which show heart (left) and fin fold (right). Dotted line, outline of fin fold. The yolk is autofluorescent. j, k, Section images of lepb:eGFP caudal fin regenerates at 2 dpa (j) and 4 dpa (k). The majority of lepb:eGFP-positive cells are mesenchymal cells, overlapping partially with cells that incorporate EdU (collected 60 minutes after injection; red). l, m Lack of detectable expression of lepb:eGFP in hearts of uninjured (l) or sham-operated (m) lepb:eGFP animals. n = 8 and 5 for uninjured and sham-operated hearts, respectively. Arrowheads, amputation planes. Scale bars: d, f, h–k, 10 μm; e, l, m, 50 μm; g, 500 μm.
Extended Data Figure 2
Extended Data Figure 2. Leptin signaling during fin and heart regeneration
a–e, Expression pattern of lepr:lepr-mCherry BAC reporter line. a, Schematic of the lepr:lepr-mCherry BAC transgenic construct. mCherry is fused at the C-terminus of Lepr. b, mCherry fluorescence in the lepr:lepr-mCherry BAC reporter strain is induced during fin regeneration. n = 5; all animals displayed a similar expression pattern. c, Section images of 4 dpa lepr:lepr-mCherry caudal fin regenerates. The majority of Lepr-mCherry+ cells are epidermal cells, overlapping partially with p63+ basal and suprabasal cells (left). In addition, some putative vascular cells in the intraray region have Lepr-mCherry signals (right). d, e, Confocal images of sections through uninjured (d) and regenerating (e) lepr:lepr-mCherry hearts. Lepr-mCherry fluorescence co-localizes with MHC+ cardiomyocytes in uninjured and 3 dpa hearts (arrows). Note that these expression patterns are similar to Leptin receptor expression in mice (See Supplementary Information). n = 7 and 6 for uninjured and 3 dpa hearts, respectively. f–j, Analysis of fin and heart regeneration in lepbpd94 mutants. f, A schematic representation of Lepb, showing the effects of the pd94 mutation. Lepb is composed of 5 alpha-helix domains. lepbpd94 has a 19 bp insertion and a 3 bp deletion at the 3rd α-helix (Helix C). g, Sequencing of wild-type and lepbpd94 alleles revealed an indel (Red highlight). h, A comparison of the amino acid sequences of Leptin genes in of human, mice, and zebrafish. The predicted amino acid sequence of the lepbpd94 gene product is shown at the bottom, with the predicted truncation sites indicated in red. The predicted lepbpd94protein product lacks the majority of C-terminal amino acids. *Identical amino acid residue between three species. i, Quantification of regenerated fin lengths from lepbpd94 and wild type siblings at 4 dpa. n = 12 each of lepbpd94 and wild-type. j, Quantification of cardiomyocyte proliferation at 7 dpa. n = 7 (lepbpd94) and 8 (wild-type). Data are represented as mean ± SEM. N.S, Not significant.
Extended Data Figure 3
Extended Data Figure 3. Identification of LEN and tests of regulatory sequences near lepb
a, Schematic depicting the genomic region surrounding lepb (corresponding to the lepb BAC used in this study) with the profiles of RNA-sequencing and H3K27ac marks from uninjured and regenerating heart tissues. b, Enlargement of the boxed area in a. lepb is the only upregulated gene in this genomic region during regeneration. H3K27ac-enriched peaks in regenerating samples are present in a ~1 kb region (red bar) that is ~7 kb upstream of the start codon. c, Schematic representation of transgenes to examine regulatory sequence activity. Fin and endocardial expression during regeneration and the number of stable lines are indicated. *One LENP2:eGFP line showed occasional, weak endocardial eGFP expression in uninjured hearts, whereas eGFP signal in this line was broad and strong during regeneration. EC, endocardial cells. d, Images of representative 0 dpa fins from lines indicated in (c). eGFP fluorescence is not detectable in fins at 0 dpa or in uninjured fins, but is induced in regenerating ray blastemas in P7:eGFP and LENP2:eGFP lines. P6:eGFP regenerates displayed weak eGFP expression below the amputation plane during regeneration, with very weak or undetectable expression in regenerating portions (see Fig. 2c). e, LENP2:eGFP expression pattern during fin regeneration. eGFP is detectable as early as 12 hpa, but is undetectable at 30 dpa. n = 5; all animals displayed a similar expression pattern. Arrowheads, amputation planes. f, Section images of representative uninjured and regenerating hearts from P2:eGFP, P6:eGFP, P7:eGFP, and LENP2:eGFP animals. eGFP fluorescence is rarely detectable in uninjured P2:eGFP, P6:eGFP, P7:eGFP, or LENP2:eGFP hearts, except in one line of LENP2:eGFP (mentioned above). Upon injury, P2 drove weak, occasional expression in cardiomyocytes and epicardium but not in endocardium, whereas P7 and LEN drove endocardial eGFP expression in ventricle and atrium. i, ii, enlargements of boxes areas in regenerating ventricle and atrium, respectively. Scale bars: d, e, 500 μm; f, 50 μm.
Extended Data Figure 4
Extended Data Figure 4. Additional putative regeneration enhancer elements
a, Cartoon depicting the distal upstream regions of il11a, cd248b, vcana, and plek. RNA-sequencing profiles indicate that these genes are upregulated during heart regeneration. The red bar indicates putative enhancer regions that are enriched with H3K27ac marks in regenerating tissue. Two of these putative enhancers, near il11a and vcana, showed primary sequence conservation in other non-mammalian vertebrates but not in mammals. b, Scheme depicting assays in injected F0 transgenic animals. At 4 dpf, eGFP expression in the uninjured fin fold was examined, and then the fin fold was amputated. eGFP expression near the amputation plane was examined at 5 dpf. c, Table indicating injected constructs and the number of animals with eGFP+ cells near the amputation plane. d, Images of representative 4 dpf (uninjured) and 5 dpf (regenerating) fin folds from animals in (c). e, Vista plot of genomic regions from mir129 to lepb based on LAGAN alignment with reference sequence zebrafish. Sequence comparison indicates that this region is not highly conserved between zebrafish and mammals. Arrowheads, amputation planes.
Extended Data Figure 5
Extended Data Figure 5. Transient transgenic assays examining lepb-linked regeneration enhancer fragments in combination with different promoters (fin regeneration)
a, Scheme depicting assays in injected F0 transgenic animals. Transgene-positive larvae were selected by detection of eGFP in response to fin fold amputation (lepb promoter), in cardiomyocytes (cmlc2 promoter), or in lenses (α-cry promoter). Caudal fins of F0 transgenic positive zebrafish were amputated at 60–90 days post-fertilization (dpf), and eGFP expression was examined at 2 dpa. b, Schematic representation of the transgenic constructs to examine fin regeneration enhancer activity. Expression during fin regeneration and the number of assessed F0 animals are indicated. Many embryos transgenic for LEN(1–850), LEN(450–1000), LEN(450–850), and LEN(660–850) coupled with the lepb or cmlc2 promoter showed activity during fin regeneration. One of 11 LENα-cry:eGFP animals displayed fin eGFP expression, but LEN(1–850)α-cry:eGFP and LEN(450–1000)α-cry:eGFP did not drive eGFP expression during fin regeneration, indicating that there may be repressive motifs in the α-cry promoter fragment that affect fin regeneration enhancer activity (See also Extended Data Fig. 9). N.D., not determined.
Extended Data Figure 6
Extended Data Figure 6. X-gal staining in stable transgenic mouse lines
a, Additional whole mount images of X-gal stained hearts from neonatal LEN-hsp68::lacZ (line 13, presented in Fig. 3) and control animals injured at postnatal day 1 and assessed at postnatal day 4. X-gal staining is undetectable in sham-operated hearts of LEN-hsp68::lacZ mice (n = 6; representative image shown) and injured hearts of control mice, but strong in partially resected hearts of LEN-hsp68::lacZ mice (Arrows). Dashed red lines indicate injury area, positioned facing the front. Arrows, injury-dependent β-galactosidase expression. dpi, days post injury. b, Whole mount images of X-gal stained hearts and paws from LEN-hsp68::lacZ line 6, which exhibited vascular endothelial expression in uninjured hearts and paws. Scale bars: 1 mm.
Extended Data Figure 7
Extended Data Figure 7. Transgenic assays examining lepb-linked regeneration enhancer fragments in combination with lepb P2 (fin regeneration)
a, Schematic representation of the transgenic constructs to examine LEN fragments that drive expression during fin regeneration. Expression during fin regeneration and the number of stable lines is indicated. b, Images of representative 0 dpa and 2 dpa fins from a. eGFP fluorescence is rarely detectable in uninjured fins. LEN(1–850), LEN(450–1000), LEN(450–850), and LEN(660–850) coupled with P2 drove eGFP expression during fin regeneration. *LEN(830–1350)P2:eGFP lines exhibited very weak eGFP expression in fin regenerates, detectable with long exposure times and at high magnification (data not shown), suggesting the possibility of minor fin regeneration enhancer elements in 850–1000. At least 5 fish from each transgenic line were examined, and all animals displayed a similar expression pattern. Arrowheads, amputation planes.
Extended Data Figure 8
Extended Data Figure 8. Images of heart sections from uninjured and regenerating transgenic lines that employ lepb-linked enhancer fragments
a–h, eGFP fluorescence is rarely detectable in uninjured hearts in all transgenic lines. One exception is LEN(1000–1350)P2:eGFP, which showed occasional, weak endocardial eGFP expression in uninjured hearts. LEN(1–850)P2:eGFP (a), LEN(450–1000)P2:eGFP (b), LEN(450–850)P2:eGFP (d), and LEN(660–850)P2:eGFP (g) transgenic lines, which include distal LEN elements, directed eGFP expression from promoters in a subset of epicardial cells and/or cardiomyocytes, but not endocardial cells. LEN(450–660)P2:eGFP lines (e) showed regeneration-dependent enhancer activity in cardiomyocytes near the injury site, but not in endocardial cells. Our data indicated that the activities of LEN(1–850)P2:eGFP (a), LEN(450–1000)P2:eGFP (b), and LEN(450–850)P2:eGFP (d) lines were not as strong as LEN(450–660)P2:eGFP (e), suggesting that there might be repressive elements for cardiomyocyte expression outside of sequences 450–660. LEN(830–1350) (c) and LEN(1000–1350) (h), which did not activate expression from promoters during fin regeneration, could direct endocardial expression in both ventricle and atrium during regeneration, similar to the reference reporters lepb:eGFP and LENP2:eGFP. Arrows in c, h, endocardial eGFP. i, ii, Enlargements of the boxed areas in regenerating ventricle and atrium, respectively. At least 5 fish from each transgenic line were examined, and all animals displayed a similar expression pattern. Scale bars, 50 μm.
Extended Data Figure 9
Extended Data Figure 9. Transgenic assays to examine lepb-linked enhancer fragment activity in combination with cmlc2 and α-cry promoters
a, Schematic representation of the transgenic constructs to examine enhancer fragment activity in combination with the cmlc2 promoter. Expression during fin regeneration and the number of stable lines is indicated. b, Images of representative 0 dpa and 2 dpa fins from a. eGFP fluorescence was very weak or undetectable in 0 dpa or uninjured fins. (1–850), (450–1000), (450–850), and (660–850) LEN fragments coupled with the cmlc2 promoter activated blastemal eGFP fluorescence (arrows) during fin regeneration. One LEN(1–850)cmlc2:eGFP line did not show fin regeneration enhancer activity. Arrowheads, amputation planes. At least five fish from each transgenic line were examined, and all animals displayed a similar expression pattern except for the following: For two strains of LEN(450–850)cmlc2:eGFP, 4 of 5 animals induced eGFP fluorescence at 2 dpa; For LEN(660–850)cmlc2:eGFP, 4 of 7 animals induced eGFP fluorescence at 2 dpa. c, (Left) Schematic diagram of the LEN(1000–1350)cmlc2:eGFP transgenic construct. (Right) Images of sections from uninjured and regenerating LEN(1000–1350)cmlc2:eGFP hearts. eGFP is expressed mosaically in cardiomyocytes via the cmlc2 promoter. Uninjured hearts had no detectable endocardial eGFP fluorescence, whereas 3 dpa hearts displayed induced endocardial eGFP fluorescence (arrows). Arrowheads indicate cardiomyocyte eGFP fluorescence driven by cmlc2 promoter activity. d–h, Schematic representation of the transgenic constructs to examine enhancer fragment activity in combination with the α-cry promoter. Expression during fin regeneration and injury-activated endocardial expression, and the number of stable lines are indicated. At least 5 fish from each transgenic line were examined, and all animals displayed a similar expression pattern. EC, endocardial cells. One LENα-cry:eGFP line showed regeneration-dependent expression (arrows) in fins (e); yet, unlike when coupled with lepb and cmlc2 promoters, the LEN(450–1000) fragment did not drive expression during fin regeneration (d and data not shown). This suggests a possible repressive motif within α-cry sequences. *One LENα-cry:eGFP line showed weak endocardial eGFP expression in uninjured hearts, but the eGFP signal (arrows) was stronger and broader during regeneration (g). Two LEN(830–1350)α-cry:eGFP lines had no detectable eGFP fluorescence in regenerating fins (f) or uninjured hearts (h), but displayed induced endocardial eGFP fluorescence (arrows) during heart regeneration (h). i, ii, Enlargements of the boxed areas in regenerating ventricle and atrium, respectively. i, LEN sequences annotated with putative binding sites in fin- (663–854) and cardiac- (1034–1350) regeneration enhancer modules. j, A predicated AP-1 binding site is necessary for fin regeneration enhancer activity. (Top) Schematic representation of the LEN(450-850-AP-1mut)P2 transgenic construct, in which the predicted AP-1 binding site (tgactca) is mutated to aaaaaa. Two LEN(450-850-AP-1mut)P2 lines had no detectable eGFP fluorescence in regenerating fins. Scale bars, 50 μm.
Extended Data Figure 10
Extended Data Figure 10. Pairing LEN with potent developmental influences can control regenerative capacity
a, Images of representative F0 transgenic zebrafish injected with P2:dnfgfr1 (left) or LENP2:dnfgfr1 (right) constructs, shown at 3 dpa. The dn-fgfr1 cassette is fused in frame to eGFP. Whereas zero of 27 P2:dnfgfr1 F0 animals displayed defective regeneration, 7 of 67 LENP2:dnfgfr1 F0 zebrafish had impaired fin regeneration in some fin rays, corresponding to eGFP fluorescence (arrow). b, Additional examples of LENP2:dnfgfr1 fins at 30 dpa, from experiments with a stable line. Inset in b, high magnification view of the boxed area, showing eGFP fluorescence. c, Quantification of regenerated area from dob; LENP2:fgf20a F0 transgenic zebrafish (n = 45, 44 at 5, 10 dpa), dob mutants (n = 19, 19 at 5, 10 dpa), and dob; P2:fgf20a F0 transgenic zebrafish (n = 40, 40 at 5, 10 dpa) at 5 dpa and 10 dpa. Dotted line indicates 500,000 μm2. d, Images of representative dob; LENP2:fgf20a F0 transgenic zebrafish, dob mutants, and dob; P2:fgf20a F0 transgenic zebrafish at 5 dpa. e, Confocal images of tissue sections of 3 dpa fin regenerates. Mosaic regenerates indicate expression of the linked ef1α:nls-mCherry marker construct (red), and EdU incorporation (collected 60 minutes after injection; green). DAPI, blue. F0 mosaic dob; LENP2:fgf20a regenerates show evidence of distal growth and blastemal EdU incorporation. Arrow, blastema. Dotted lines, amputation planes. i, ii, Enlargements of the boxed areas. f, In situ hybridization in sections of 3 dpa fin regenerates from dob; P2:fgf20a (left) and F0 mosaic dob; LENP2:fgf20a (right) animals, indicating LEN-induced fgf20a expression in mesenchymal cells and regenerative growth. fgf20a is rarely detected in dob; P2:fgf20a regenerates. Arrowheads, amputation planes.
Figure 1
Figure 1. Activation of lepb regulatory sequences during tissue regeneration
a, b, Regenerating heart (a) and fin (b) tissues. c, Genes with increased transcript levels in regenerating fins and/or hearts. lepb is in red. FC, fold-change. d, lepb:eGFP BAC transgenic construct, with the first exon replaced by eGFP. e, lepb:eGFP fluorescence (arrows) is detected in fins regenerating after amputation. dpa: days post-amputation. f, g, lepb:eGFP fluorescence is undetectable in uninjured hearts (see Extended Data Fig. 1), but induced in regenerating hearts by 3 dpa. lepb:eGFP fluorescence (arrows in g) does not co-localize with MHC+ cardiomyocytes (f), but co-localizes with Raldh2+ endocardial cells (g). Antibodies detected eGFP, MHC, and Raldh2 in f, g. n = 8; all animals displayed a similar expression pattern. Scale bars: e, 500 μm; f, g, 50 μm.
Figure 2
Figure 2. A DNA element upstream of lepb directs regeneration-dependent gene expression
a, Genomic DNA regions surrounding lepb, indicating RNA-seq and H3K27ac profiles from uninjured and regenerating hearts. Red bar, distal lepb-linked element enriched with H3K27ac marks (LEN). b, Transgene constructs examined for regeneration-dependent expression in fin or heart. EC, endocardial cells. c, (Top) Images of 2 dpa regenerating fins from transgenic reporter lines. Arrowhead, amputation plane. Arrows, blastemal eGFP. (Middle) Section images of resected ventricular region at 3 dpa. (Bottom) Atrial tissue distant from injury site. At least 5 fish from each transgenic line were examined, and all animals displayed a similar expression pattern. Arrows, endocardial eGFP. Scale bars: Top, 500 μm; Middle, 50 μm.
Figure 3
Figure 3. LEN activity in neonatal mice
a, Whole-mount (top) and section (bottom) images of X-gal stained hearts of LEN-hsp68::lacZ and Ctrl-hsp68::lacZ (control) lines, with clear staining in partially resected hearts of LEN-hsp68::lacZ mice (arrows) but not controls. n = 5, 5, 6, and 4 for uninjured LEN-hsp68::lacZ, 3 days post-injury (dpi) LEN-hsp68::lacZ, uninjured control, and 3 dpi control hearts, respectively. Six sham-operated hearts showed minimal staining (see Extended Data Fig. 6). Dashed red lines indicate injury area, positioned facing the front. Arrows, injury-dependent β-galactosidase expression. b, Whole-mount (left) and section (right) images of X-gal-stained digits from these lines, with X-gal staining detectable in amputated, but not uninjured, digits of LEN-hsp68::lacZ mice. n = 14(7) and 12(6) for LEN-hsp68::lacZ and control digits (animals), respectively. Injuries were performed in neonatal mice on postnatal day 1 and assessed for expression on postnatal day 4. Arrowheads, injury planes. Arrows, injury-dependent β-galactosidase expression. P1, P2, P3, proximal, middle, and distal phalange, respectively. Scale bars: 1 mm.
Figure 4
Figure 4. LEN is separable into tissue-specific elements
a, Transgene constructs to examine enhancer activation in regenerating fin or cardiac tissue. EC, endocardial cells. b, Regenerating fins (top) and sections of cardiac tissue from transgenic lines in a. Middle, resected ventricle region. Bottom, atrial tissue distant from injury site. At least 5 fish from each transgenic line were examined, and all animals displayed a similar expression pattern. Arrowheads, amputation plane. Arrows, blastemal (fin) or endocardial (heart) eGFP. c, Cartoon indicating separable tissue-specific regeneration modules in LEN. Scale bars: b, 50 μm.
Figure 5
Figure 5. LEN controls fin regeneration when paired with Fgf effectors
a, Quantification of 3rd and 4th ray lengths from each lobe at 3 and 5 dpa. *P < 0.01, One-way ANOVA; n = 40 (10), 56 (14), and 40 (10) for wild-type, P2:dnfgfr1, and LENP2:dnfgfr1 fin rays (animals), respectively. b, Representative images of 5 dpa fin regenerates that were used for quantification of regenerate lengths in (a). Bottom, inset indicates dnfgfr1-eGFP fluorescence from boxed area. c, Images of 30 dpa LENP2:dnfgfr1 fin regenerate. i, ii, eGFP fluorescence from boxed areas, maintained in impaired rays (right). d, Section ISH for fgf20a expression (arrows) in wild-type, dob; LENP2:fgf20a, dob, and dob; P2:fgf20a fin regenerates at 3 dpa. e, 3 dpa fin regenerates from animals in (d), stained for EdU incorporation (green) and nuclei (DAPI, blue), indicating extensive blastemal proliferation in wild-type and dob; LENP2:fgf20a regenerates. Fins were collected 60 minutes after EdU injection. f, Quantification of 3rd and 4th ray lengths from each lobe at 5 and 10 dpa. *P < 0.01, One-way ANOVA; n = 100 (25), 72 (18), 56 (14), and 100 (25) for wild-type, dob; LENP2:fgf20a, dob, and dob; P2:fgf20a fin rays (animals) at 5 dpa, respectively; n = 98 (25), 72 (18), 56 (14), and 96 (24) at 10 dpa, respectively. g, Representative images of 5 dpa fin regenerates that were used for quantification of regenerate lengths in (f). The LENP2:fgf20a transgene rescues fin regeneration in dob animals, shown with controls at 5 dpa. Arrowheads in b–e, g, amputation planes. Scale bars: b, c, g, 500 μm; d, e, 20 μm.
Figure 6
Figure 6. Enhancer-driven nrg1 expression boosts cardiomyocyte proliferation
a, Representative images of section ISH for nrg1 in P2:nrg1 (top) and LENP2:nrg1 (bottom) ventricles, at several times post-resection. P2:nrg1: n = 4, 8, 7, and 3 for 3, 7, 14, and 30 dpa, respectively. LENP2:nrg1: n = 4, 8, 8, and 4 for 3, 7, 14, and 30 dpa, respectively. Dashed lines, approximate resection planes. nrg1 (violet) is sharply induced in endocardial and epicardial cells in LENP2:nrg1 ventricular injuries. b, qPCR analsysis of nrg1 in whole P2:nrg1 or LENP2:nrg1 cardiac ventricles at 3 dpa. c, Section images of 14 dpa regenerating ventricular apices from P2:nrg1 (top) and LENP2:nrg1 (bottom) animals, stained for cardiomyocyte nuclei (MEF2; red) and the proliferation marker PCNA (green). Insets indicated high-magnification view of regenerating area. Arrowheads, MEF2+PCNA+ cardiomyocytes. d, Quantified cardiomyocyte proliferation indices in injury sites in experiments from c. *P < 0.01, Mann-Whitney rank sum test ; n = 11 (P2:nrg1) and 15 (LENP2:nrg1). Scale bars: a, c, 50 μm. Error bars indicate standard error.

References

    1. Poss KD. Advances in understanding tissue regenerative capacity and mechanisms in animals. Nat Rev Gen. 2010;11:710–722. - PMC - PubMed
    1. Nacu E, Tanaka EM. Limb regeneration: a new development? Ann Rev Cell Dev Biol. 2011;27:409–440. - PubMed
    1. Kumar A, Godwin JW, Gates PB, Garza-Garcia AA, Brockes JP. Molecular basis for the nerve dependence of limb regeneration in an adult vertebrate. Science. 2007;318:772–777. - PMC - PubMed
    1. Whitehead GG, Makino S, Lien CL, Keating M. T fgf20 is essential for initiating zebrafish fin regeneration. Science. 2005;310:1957–1960. - PubMed
    1. Wehner D, Weidinger G. Signaling networks organizing regenerative growth of the zebrafish fin. Trends Genet. 2015;31:336–343. - PubMed

Publication types

MeSH terms