. 2016 Apr 14;532(7598):240-244.
doi: 10.1038/nature17630. Epub 2016 Apr 6.

TAM receptors regulate multiple features of microglial physiology

Affiliations

TAM receptors regulate multiple features of microglial physiology

Lawrence Fourgeaud et al. Nature. .

Abstract

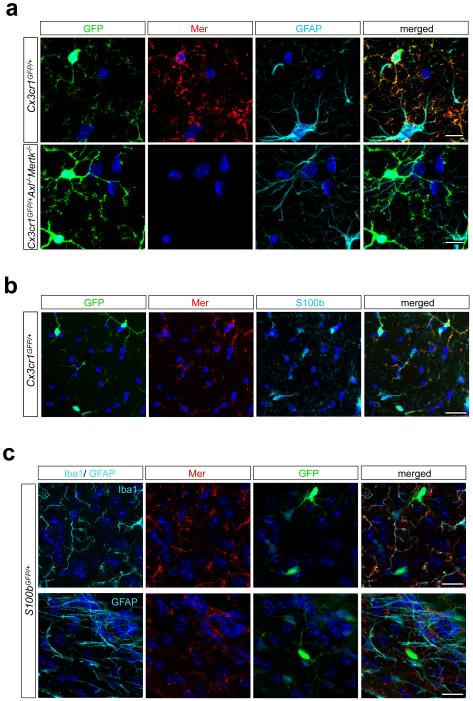
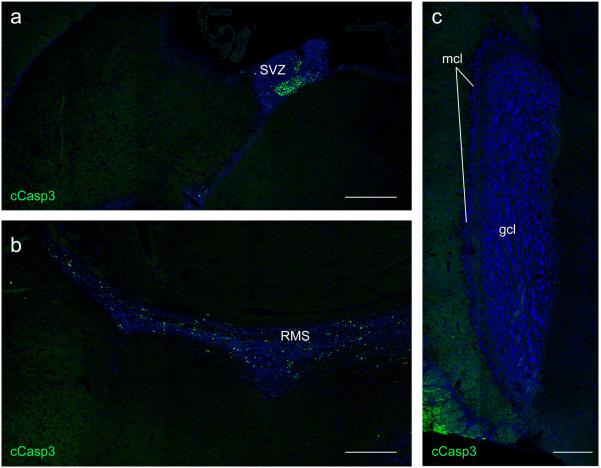
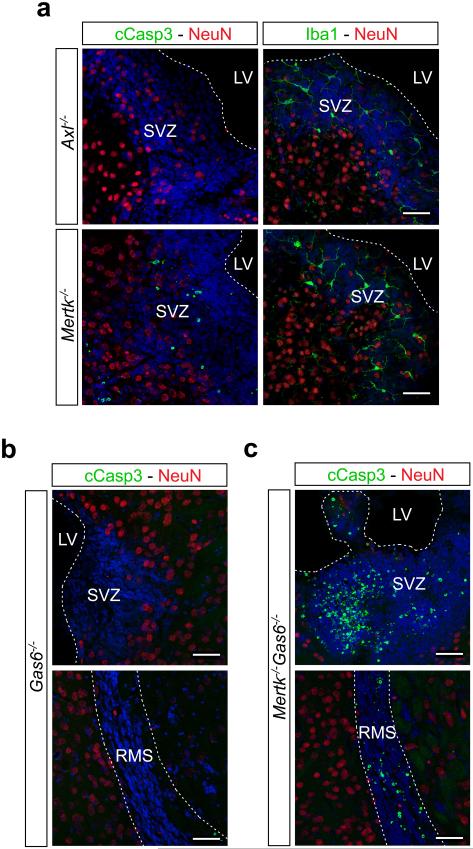
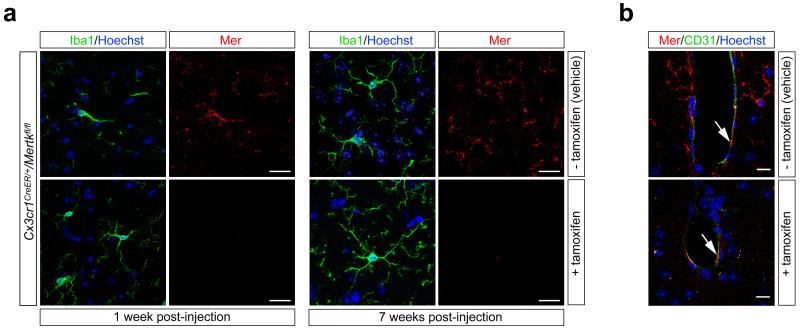
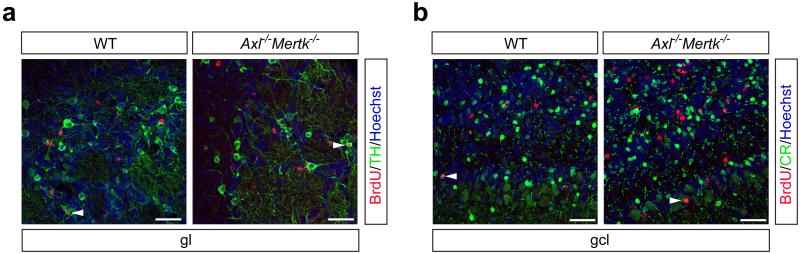
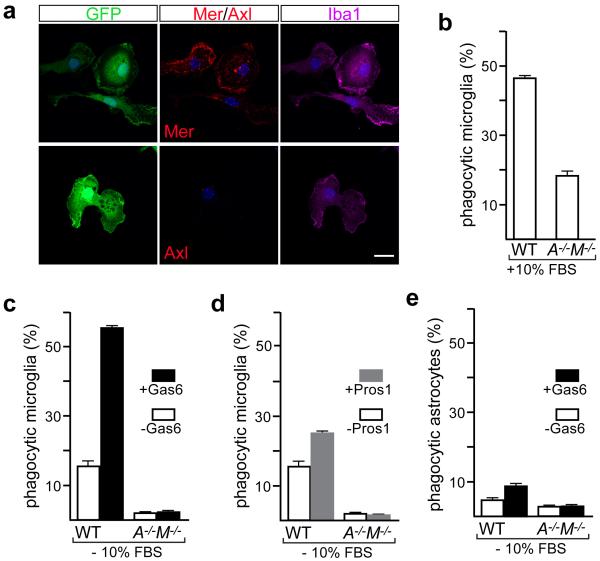
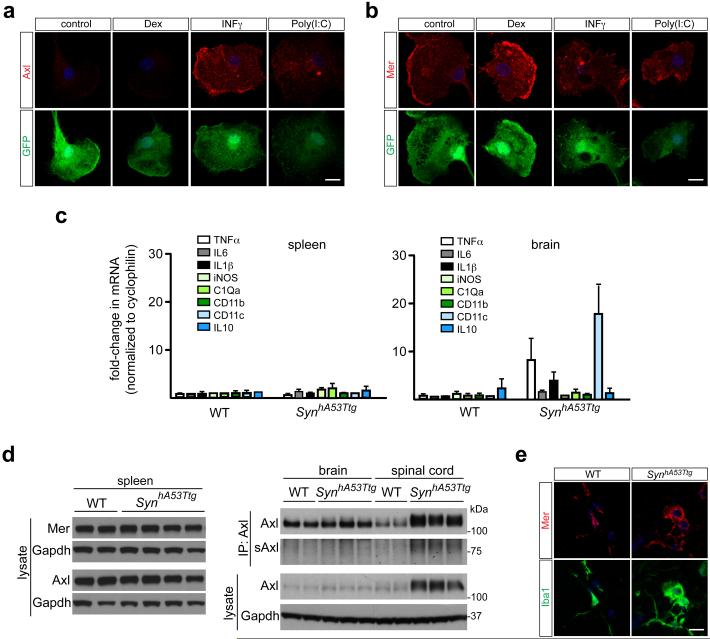
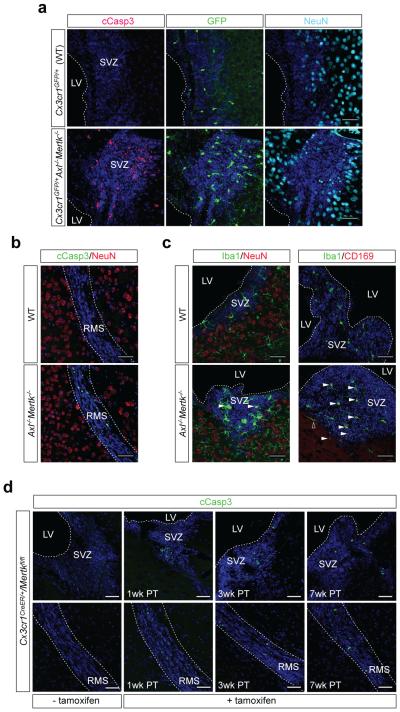
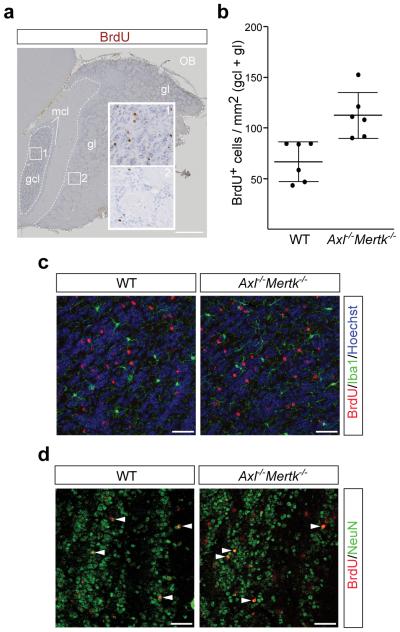
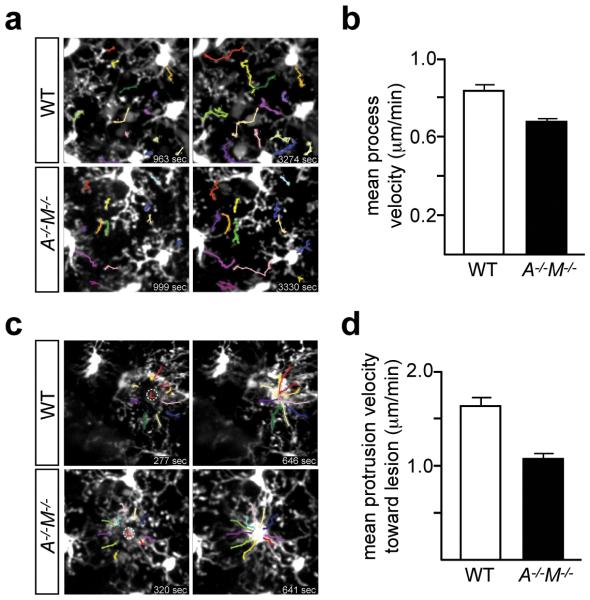
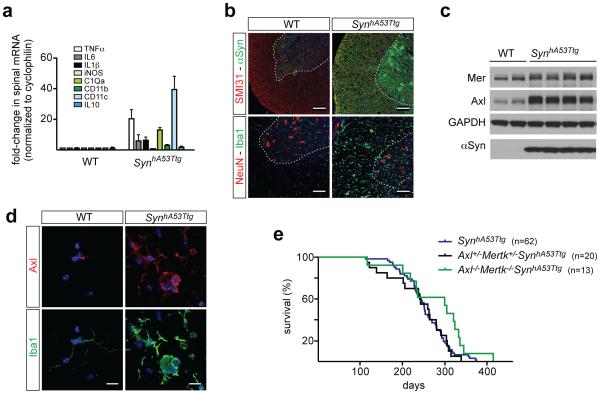
Microglia are damage sensors for the central nervous system (CNS), and the phagocytes responsible for routine non-inflammatory clearance of dead brain cells. Here we show that the TAM receptor tyrosine kinases Mer and Axl regulate these microglial functions. We find that adult mice deficient in microglial Mer and Axl exhibit a marked accumulation of apoptotic cells specifically in neurogenic regions of the CNS, and that microglial phagocytosis of the apoptotic cells generated during adult neurogenesis is normally driven by both TAM receptor ligands Gas6 and protein S. Using live two-photon imaging, we demonstrate that the microglial response to brain damage is also TAM-regulated, as TAM-deficient microglia display reduced process motility and delayed convergence to sites of injury. Finally, we show that microglial expression of Axl is prominently upregulated in the inflammatory environment that develops in a mouse model of Parkinson's disease. Together, these results establish TAM receptors as both controllers of microglial physiology and potential targets for therapeutic intervention in CNS disease.


Figures

Extended Data Figure 1
Mer is expressed by microglia. a, Brain (hippocampus) sections from Cx3cr1GFP/+ mice that were WT (top row) or Axl−/−Mertk−/− (bottom row) were visualized by confocal microscopy for GFP (1st column), anti-Mer (red, 2nd column), or anti-GFAP (cyan, 3rd column) immunoreactivity. Fourth column, merged images. Scale bars 10 μm. Axl immunostaining signal is too low to be visualized in unactivated microglia (not shown; but see Fig. 4d). b, Mer expression does not co-localize with S100b+ cells. Immunostaining of Cx3cr1GFP/+ brain sections with anti-Mer (red, 2nd panel) and anti-S100b (cyan, 3rd panel). Fourth panel, merged images. c, Mer co-localizes with Iba1, but not GFAP or GFP in S100bGFP/+ mice. Brain sections were visualized by confocal microscopy for anti-Iba1 (top) or anti-GFAP (bottom) (both cyan, 1st column), anti-Mer (red, 2nd column), or GFP (green, 3rd column) immunoreactivity. Fourth column, merged images. Scale bars for b, c 20 μm. Representative images from analyses performed in n = 2 mice (a-c)
Extended Data Figure 2
Apoptotic cell (AC) accumulation is confined to neurogenic and derivative migratory regions of the Axl−/−Mertk−/− CNS. a, A low power tiled image of a section through the Axl−/−Mertk−/− subventricular zone (SVZ) and surrounding brain tissue, stained for cCasp3, illustrates that ACs are confined within the SVZ. b, A low power tiled image of a section through the Axl−/−Mertk−/− rostral migratory stream (RMS) and surrounding brain tissue illustrates that cCasp3+ ACs are confined within the RMS. c, A low power tiled image of the granule cell and mitral cell layers (gcl and mcl, respectively) of the Axl−/−Mertk−/− olfactory bulb, stained for cCasp3, illustrates that there are no ACs detected in the double mutant bulb. Scale bars for a-c, 200 μm. Representative images from analyses performed in n = 3 mice (a-c)
Extended Data Figure 3
Mer is the principal microglial TAM receptor required for AC phagocytosis in the SVZ. a, Sections of the SVZ from Axl−/− (top row) and Mertk−/− (bottom row) mice immunostained for cCasp3 and NeuN (green and red, respectively; left panels), or Iba1 and NeuN (green and red, respectively; right panels) reveal the accumulation of cCasp3+ ACs only in the Mertk−/− SVZ. b, Sections of the SVZ (top) and RMS (bottom) of Gas6−/− mice, illustrating no AC accumulation (similar to both WT and Axl−/−). c, Sections of the SVZ (top) and RMS (bottom) of Mertk−/−Gas6−/− mice, illustrating a massive accumulation of ACs similar to that seen in Axl−/−Mertk−/− mice. Scale bars 50 μm. See text for quantification. Representative images from analyses performed in n = 2 mice for Gas6−/− and Mertk−/−Gas6−/−, and n = 3 mice for Axl−/− and Mertk−/−.
Extended Data Figure 4
Conditional Mertk knock-outs. The knock-out strategy targets exon 18 of the WT mouse Mertk gene, which encodes residues W779-L824 of the tyrosine kinase domain (1st line). Deletion of this exon leads to a functional and protein null (see Methods, and Extended Data Fig. 5). The targeting vector (2nd line) had a pgk-Neo cassette for selection in ES cells, and contained loxP and FRT sites, recognized by Cre and Flp recombinases, respectively, at the indicated positions. Five ES cell lines with homologous recombination at the Mertk locus were identified by Southern blots of MfeI-digested DNA, using the indicated Pb 1/2 (external) and Pb 3/4 (internal) probes (3rd line). Introduction of Flp recombinase, achieved by crossing high percentage chimeras (obtained from blastocyst injection of these ES cells) to C57Bl/6 FLP mice, removed the Neo cassette, leaving exon 18 flanked by loxP sites (4th line). Cre-mediated recombination at these loxP sites deletes exon 18. Mertkfl/fl mice, together with PCR-based protocols for their genotyping, are available upon request from the Rothlin laboratory (carla.rothlin@yale.edu). See Methods.
Extended Data Figure 5
Persistence of microglial-specific Mer ablation following tamoxifen injection of Cx3cr1CreER/+Mertkfl/fl mice. a, Mice were injected IP with oil vehicle alone (− tamoxifen, top row) or with tamoxifen (+ tamoxifen, bottom row) (see Methods), and brain sections were immunostained for Mer protein expression (red panels in 2nd, 4th columns) in Iba1+ microglia (green panels in 1st, 3rd columns) at 1 wk (left four panels) and 7 wks (right four panels) after injection. Sections counter-stained with Hoechst 33258 to visualize nuclei (blue). b, Brain sections containing a brain capillary 7 weeks after injection of vehicle (top) or tamoxifen (bottom), showing that while Mer expression in microglia is eliminated upon tamoxifen-mediated Cx3cr1-restricted induction of Cre activity, Mer expression in CD31+ microvascular endothelial cells (arrows) is maintained. Representative images of n = 2 mice per time point.
Extended Data Figure 6
Identity of immigrant BrdU+ cells in the olfactory bulb (OB). a, Some BrdU+ cells in the glomerular layer (gl), visualized 35 days after injection of BrdU (red) and presumed immigrant descendants of SVZ cells in S phase at the time of injection, are also positive for tyrosine hydroxylase (green) in both WT (left panel) and Axl−/−Mertk−/− (right panel) mice. Arrowheads are examples of TH+BrdU+ cells. b, Similar comparative granule cell layer (gcl) sections stained with anti-BrdU (red) and calretinin (CR, green). Arrowheads are examples of CR+BrdU+ cells. Panels co-stained with Hoechst 33258 to visualize nuclei. Scale bars 50 μm. Representative images of n = 2 per genotype.
Extended Data Figure 7
Both Gas6 and Pros1 drive microglial phagocytosis of ACs in vitro. a, Cultured microglia express Mer but little or no Axl under basal conditions. Microglia were cultured from WT Cx3cr1GFP/+ mice, visualized for GFP (1st column), and immunostained for Iba1 (3rd column), Mer (2nd column, top), and Axl (2nd column, bottom). Scale bar 10 μm. b-d, In vitro pHrodo-based assay of AC phagocytosis by microglia (see Methods). b, In serum-containing medium (10% FBS), WT microglia are vigorous phagocytes; mean phagocytic activity is substantially reduced in Axl−/−Mertk−/− (A−/−M−/−) microglia. c, d, Both purified Gas6 (c) and purified Pros1 (d) stimulate AC phagocytosis by cultured microglia in serum-free medium, and this stimulation is entirely TAM-dependent. e, The phagocytic activity of cultured astroglia prepared from Cx3cr1GFP/+ mice that were either WT or Axl−/−Mertk−/− was measured in the same pHrodo-based assay in serum-free medium ± Gas6. For this FACS-based assay, astrocytes were gated using an astrocyte-specific surface antigen-2 (ACSA-2) antibody (see Methods). Bar graphs represent mean phagocytic activity (± SEM); n = 2 replicates from 2 mice per genotype for b-d, and 2 replicates from 4 mice per genotype for e.
Extended Data Figure 8
Regulation of microglial Axl by neuroinflammation. a, Axl and b, Mer regulation in purified (GFP+) cultured microglia by the tolerogenic stimulus dexamethasone (Dex) and the two proinflammatory stimuli IFNγ and poly(I:C), as assessed by immunostaining. Axl expression (a) is very low in the absence of an added stimulus, is not elevated by Dex, but is strongly up-regulated by both IFNγ and poly(I:C). In contrast, Mer expression (b) is readily detected in the absence of an added stimulus, is further elevated by Dex, but is modestly suppressed by both IFNγ and poly(I:C). Scale bar 10 μm. c, In contrast to the spinal cord (see Figure 4a), there is no up-regulation of the indicated inflammatory mediator/marker mRNAs (mean expression ± SEM) in the spleens, and only modest up-regulation in the brains, of SynhA53Ttg mice at 8-10 months of age. n=3 mice for each genotype. d, Western blot analysis of spleen (left blots) and brain and spinal cord (right blots) extracts from two different WT mice and four or three different SynhA53Ttg mice at 9-10 months, for the indicated proteins, with Gapdh as a loading control. Note that soluble Axl ectodomain (sAxl) is up-regulated in the SynhA53Ttg spinal cord concomitantly with Axl. e, Although Axl is strongly up-regulated in Iba1+ microglia in the SynhA53Ttg spinal cord (see Figure 4d), no up-regulation of Mer is observed in these same cells. Scale bar 10 μm. n = 2 WT and 3 SynhA53Ttg mice.
Figure 1
Figure 1
TAM signaling mediates microglial phagocytosis of ACs in brain neurogenic regions. a, SVZ sections adjacent to the LV of WT (top row) or Axl−/−Mertk−/− (bottom row) Cx3cr1GFP/+ brains visualized for GFP (green, 2nd column), cCasp3 (magenta, 1st column), and NeuN (cyan, 3rd column). b, RMS of WT (top) and Axl−/−Mertk−/− brains (bottom) immunostained for cCasp3 (green) and NeuN (red). c, Immunostaining of WT (top) and Axl−/−Mertk−/− SVZ (bottom) with anti-Iba1 (green) and anti-NeuN (red) (left panels) or anti-Iba1 (green) and anti-CD169 (red) (right panels). Arrowheads mark Iba1+ microglia with an amoeboid morphology (lower left) and Iba1+CD169+ double-positive microglia (lower right); open arrowhead is an Iba1+CD169 cell outside the SVZ. d, No cCasp3+ ACs accumulate in the SVZ (top) or RMS (bottom) of Cx3cr1CreER/+Mertkfl/fl mice 1 wk after vehicle injection (− tamoxifen, 1st panels), but many are evident in the SVZ and RMS at 1, 3, and 7 wks after injection with vehicle + tamoxifen to induce Cre expression in Cx3cr1+ microglia (+ tamoxifen, 2nd, 3rd, and 4th panels, respectively). All a-d sections co-stained with nuclear Hoechst 33258 (blue). Representative images from analyses performed in 3 (a, b, d) and 2 (c) mice. Scale bars 50 μm.
Figure 2
Figure 2
TAM signaling mediates ‘death by phagocytosis’. a, Axl−/−Mertk−/− OB section five weeks after BrdU pulse labeling, visualized with an anti-BrdU antibody (brown). The granule cell layer (gcl), glomerular layer (gl), and mitral cell layer (mcl) are indicated, and regions of the gcl (1) and gl (2) are enlarged. Scale bar 500 μm. b, Quantification of BrdU+ cells per mm2 in the gcl and gl of 6 WT versus 6 Axl−/−Mertk−/− mice; Graph plots average ± SEM; Two-tailed unpaired Mann Whitney p=0.002. c, BrdU+ cells in the gcl 35 days after injection of BrdU (red) are negative for Iba1 (green) in WT (left panel) and Axl−/−Mertk−/− (right panel) mice. d, Similar gcl sections stained with anti-BrdU (red) and NeuN (green). Arrowheads mark NeuN+BrdU+ cells. Panels in c co-stained with Hoechst 33258. Scale bars (c, d) 50 μm. Representative images of n = 2 per genotype.
Figure 3
Figure 3
TAM signaling regulates microglial process extension velocity and response to vascular injury. a, Two video stills for WT (top row) and Axl−/−Mertk−/− (A−/−M−/−, bottom row) Cx3cr1GFP/+ mice, with tracking of individual GFP-labeled processes (color-coded) in the unperturbed visual cortex, by live two-photon imaging. Stills are from Supplementary Videos 2 (WT) and 3 (A−/−M−/−), and indicated times are from the start of the video. b, Mean process velocity (± SEM) in the absence of perturbation. n = 53 measurements in 3 WT mice, and n = 42 measurements in 3 A−/−M−/− mice; Two-tailed unpaired Mann Whitney p= 0.0004. c, Two video stills for WT (top row) and A−/−M−/− (bottom row) Cx3cr1GFP/+ mice, illustrating microglial process tracking (color-coded) toward a laser-induced rupture of a brain microvessel (circled L) by two-photon imaging. Stills are from Supplementary Videos 4 (WT) and 5 (A−/−M−/−), and indicated times are from the generation of the laser lesion. d, Mean process extension velocity (± SEM) toward the lesion site. n = 20 measurements performed in 2 WT mice and n = 30 measurements performed in 3 A−/−M−/− mice; Two-tailed unpaired Mann Whitney p= < 0.0001.
Figure 4
Figure 4
Microglial Axl is up-regulated in a mouse model of Parkinson’s disease. a, Comparison of the mean expression (± SEM) of the indicated inflammatory mediator/marker mRNAs in the spinal cords of 3 WT and 3 Thy1-SynhA53Ttg (SynhA53Ttg) mice at 8-10 months. b, Sections from the spinal cords of aged (8-9 month) WT (left column) and SynhA53Ttg (right column) mice, immunostained for phosphorylated neurofilament (SMI31) and α-synuclein (top panels), or NeuN and Iba1 (bottom panels). The α-synuclein antibody recognizes both the endogenous mouse protein and the transgenic human protein. Scale bars 100 μm. c, Western blots of spinal cord extracts from 2 WT mice (lanes 1, 2) and 4 SynhA53Ttg mice (lanes 3-6) for the indicated proteins at 9-10 months age, with GAPDH as a loading control. d, Sections from WT (left column) and SynhA53Ttg (right column) spinal cords immunostained with anti-Axl (top row) and anti-Iba1 (bottom row) antibodies. Scale bar 10 μm. e, Kaplan-Meier survival curves for mice of the indicated genotypes. n=62 SynhA53Ttg mice, n=20 A+/−M+/− SynhA53Ttg and n=13 A−/−M−/− SynhA53Ttg mice. Log-rank (Mantel-Cox) test p = 0.72 between SynhA53Ttg and A+/−M+/− SynhA53Ttg; p = 0.04 between SynhA53Ttg and A−/−M−/− SynhA53Ttg. Representative images from n=2 WT and 3 SynhA53Ttg mice (b and d).

Comment in

References

    1. Ransohoff RM, Cardona AE. The myeloid cells of the central nervous system parenchyma. Nature. 2010;468:253–262. - PubMed
    1. Lemke G. Biology of the TAM receptors. Cold Spring Harbor Perspectives. 2013;5(11) doi: 10.1101/cshperspect.a009076. - PMC - PubMed
    1. Aimone JB, et al. Regulation and function of adult neurogenesis: from genes to cognition. Physiol Rev. 2014;94:991–1026. - PMC - PubMed
    1. Sierra A, et al. Microglia shape adult hippocampal neurogenesis through apoptosis-coupled phagocytosis. Cell stem cell. 2010;7:483–495. - PMC - PubMed
    1. Lew ED, et al. Differential TAM receptor-ligand-phospholipid interactions delimit differential TAM bioactivities. eLife. 2014;3:e03385. - PMC - PubMed

Publication types

MeSH terms