

Identification of Differentially Expressed Genes through Integrated Study of Alzheimer's Disease Affected Brain Regions
- PMID: 27050411
- PMCID: PMC4822961
- DOI: 10.1371/journal.pone.0152342
Identification of Differentially Expressed Genes through Integrated Study of Alzheimer's Disease Affected Brain Regions
Abstract
Background: Alzheimer's disease (AD) is the most common form of dementia in older adults that damages the brain and results in impaired memory, thinking and behaviour. The identification of differentially expressed genes and related pathways among affected brain regions can provide more information on the mechanisms of AD. In the past decade, several studies have reported many genes that are associated with AD. This wealth of information has become difficult to follow and interpret as most of the results are conflicting. In that case, it is worth doing an integrated study of multiple datasets that helps to increase the total number of samples and the statistical power in detecting biomarkers. In this study, we present an integrated analysis of five different brain region datasets and introduce new genes that warrant further investigation.
Methods: The aim of our study is to apply a novel combinatorial optimisation based meta-analysis approach to identify differentially expressed genes that are associated to AD across brain regions. In this study, microarray gene expression data from 161 samples (74 non-demented controls, 87 AD) from the Entorhinal Cortex (EC), Hippocampus (HIP), Middle temporal gyrus (MTG), Posterior cingulate cortex (PC), Superior frontal gyrus (SFG) and visual cortex (VCX) brain regions were integrated and analysed using our method. The results are then compared to two popular meta-analysis methods, RankProd and GeneMeta, and to what can be obtained by analysing the individual datasets.
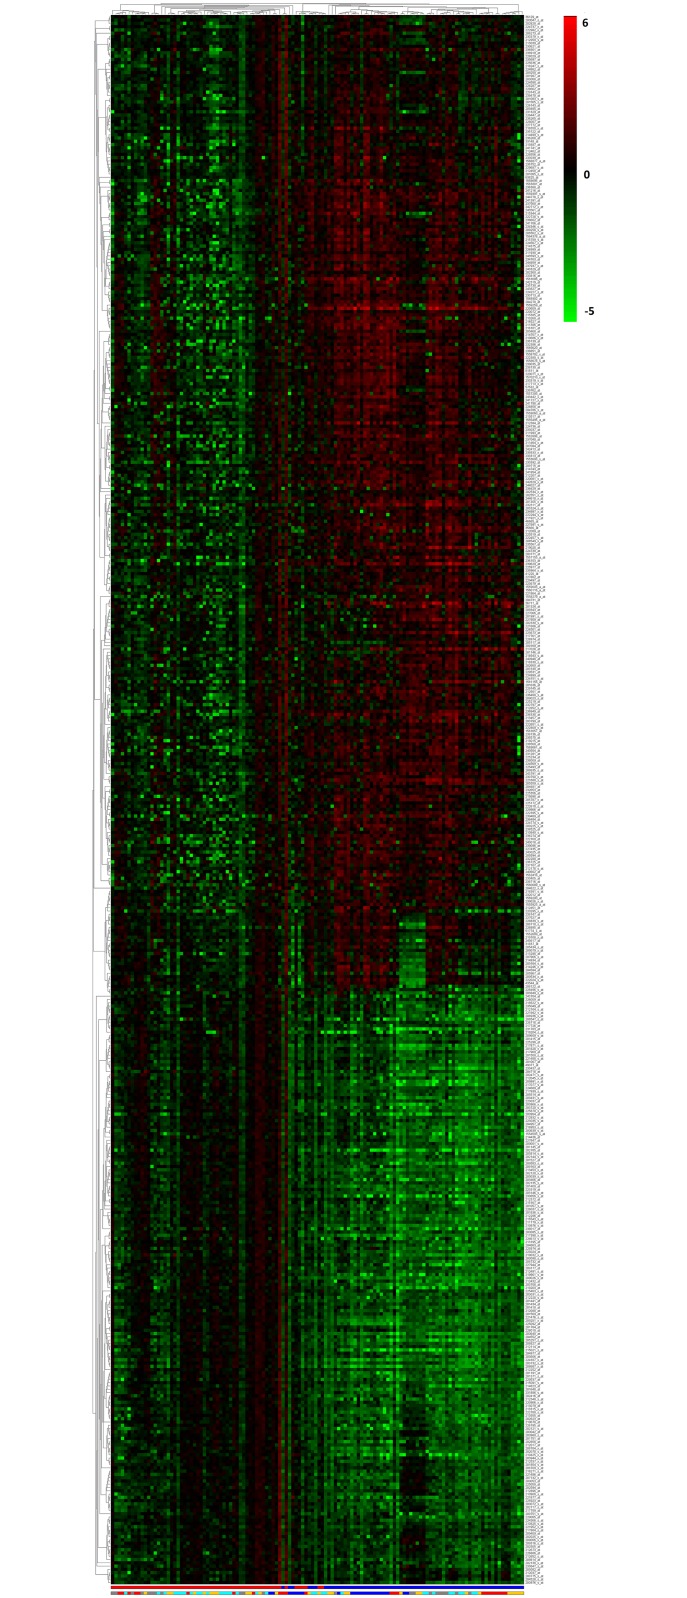
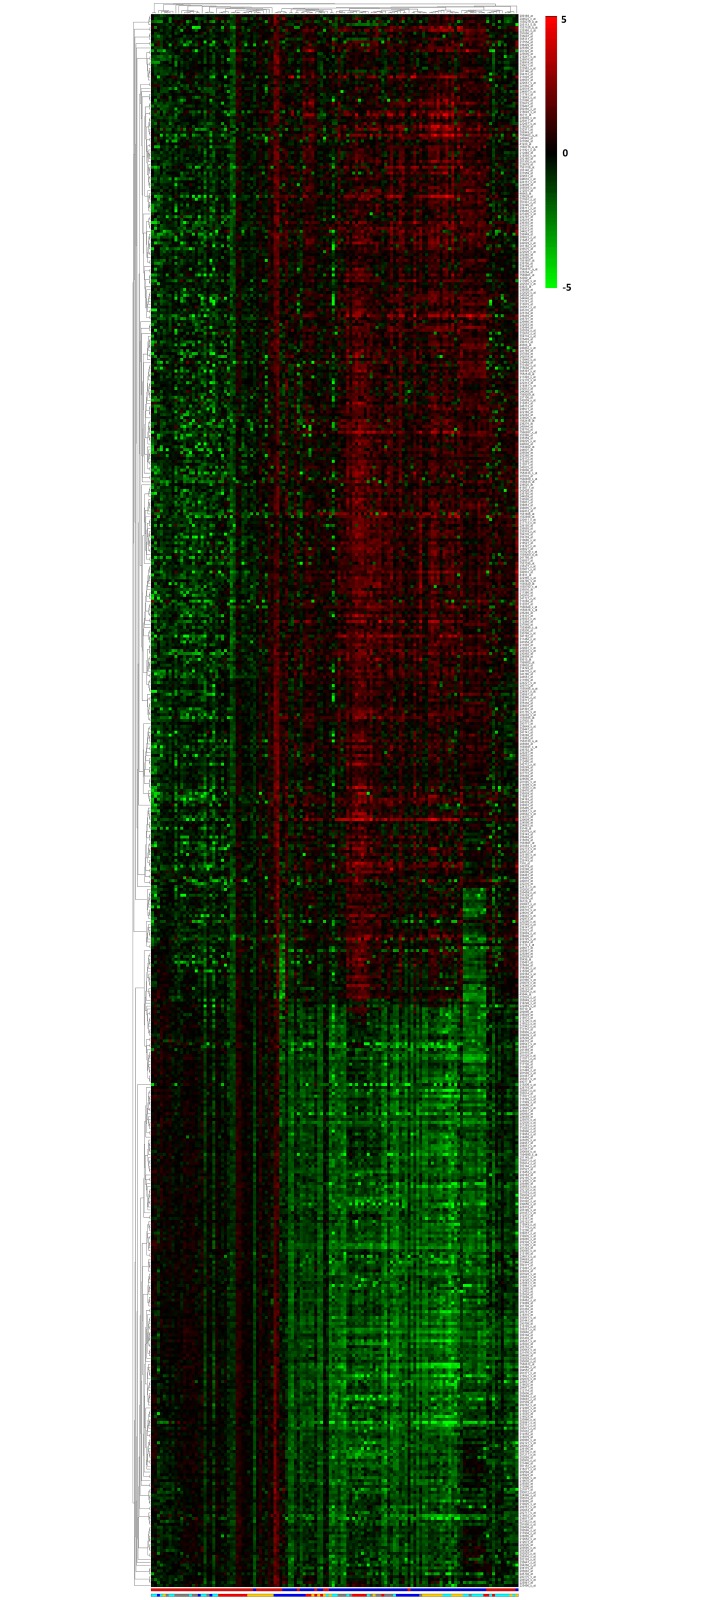
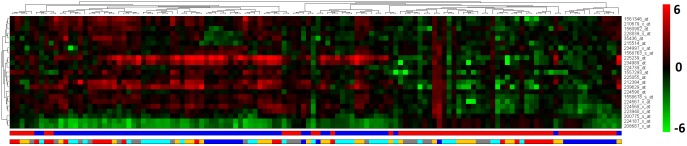
Results: We find genes related with AD that are consistent with existing studies, and new candidate genes not previously related with AD. Our study confirms the up-regualtion of INFAR2 and PTMA along with the down regulation of GPHN, RAB2A, PSMD14 and FGF. Novel genes PSMB2, WNK1, RPL15, SEMA4C, RWDD2A and LARGE are found to be differentially expressed across all brain regions. Further investigation on these genes may provide new insights into the development of AD. In addition, we identified the presence of 23 non-coding features, including four miRNA precursors (miR-7, miR570, miR-1229 and miR-6821), dysregulated across the brain regions. Furthermore, we compared our results with two popular meta-analysis methods RankProd and GeneMeta to validate our findings and performed a sensitivity analysis by removing one dataset at a time to assess the robustness of our results. These new findings may provide new insights into the disease mechanisms and thus make a significant contribution in the near future towards understanding, prevention and cure of AD.
Conflict of interest statement
Figures
Similar articles
-
Co-expression Network Analysis Revealing the Potential Regulatory Roles of lncRNAs in Alzheimer's Disease.Interdiscip Sci. 2019 Dec;11(4):645-654. doi: 10.1007/s12539-019-00319-w. Epub 2019 Feb 4. Interdiscip Sci. 2019. PMID: 30715720
-
Integrated Analysis of Alzheimer's Disease and Schizophrenia Dataset Revealed Different Expression Pattern in Learning and Memory.J Alzheimers Dis. 2016;51(2):417-25. doi: 10.3233/JAD-150807. J Alzheimers Dis. 2016. PMID: 26890750
-
Bioinformatics analysis of differentially expressed genes and identification of an miRNA-mRNA network associated with entorhinal cortex and hippocampus in Alzheimer's disease.Hereditas. 2021 Jul 9;158(1):25. doi: 10.1186/s41065-021-00190-0. Hereditas. 2021. PMID: 34243818 Free PMC article.
-
Systematic review and meta-analysis of bulk RNAseq studies in human Alzheimer's disease brain tissue.Alzheimers Dement. 2025 Mar;21(3):e70025. doi: 10.1002/alz.70025. Alzheimers Dement. 2025. PMID: 40042520 Free PMC article.
-
Micro RNA as a potential blood-based epigenetic biomarker for Alzheimer's disease.Clin Biochem. 2018 Aug;58:5-14. doi: 10.1016/j.clinbiochem.2018.05.020. Epub 2018 Jun 6. Clin Biochem. 2018. PMID: 29885309 Review.
Cited by
-
Multiscale network modeling of oligodendrocytes reveals molecular components of myelin dysregulation in Alzheimer's disease.Mol Neurodegener. 2017 Nov 6;12(1):82. doi: 10.1186/s13024-017-0219-3. Mol Neurodegener. 2017. PMID: 29110684 Free PMC article.
-
Unveiling the hemolymphatic miRNome composition of the schistosomiasis vector snail Biomphalaria glabrata.Curr Res Parasitol Vector Borne Dis. 2025 Apr 22;7:100262. doi: 10.1016/j.crpvbd.2025.100262. eCollection 2025. Curr Res Parasitol Vector Borne Dis. 2025. PMID: 40666502 Free PMC article.
-
Long noncoding RNA NEAT1 mediates neuronal histone methylation and age-related memory impairment.Sci Signal. 2019 Jul 2;12(588):eaaw9277. doi: 10.1126/scisignal.aaw9277. Sci Signal. 2019. PMID: 31266852 Free PMC article.
-
Multi-Transcript Level Profiling Revealed Distinct mRNA, miRNA, and tRNA-Derived Fragment Bio-Signatures for Coping Behavior Linked Haplotypes in HPA Axis and Limbic System.Front Genet. 2021 Aug 19;12:635794. doi: 10.3389/fgene.2021.635794. eCollection 2021. Front Genet. 2021. PMID: 34490028 Free PMC article.
-
WNKs regulate mouse behavior and alter central nervous system glucose uptake and insulin signaling.bioRxiv [Preprint]. 2024 Jun 22:2024.06.09.598125. doi: 10.1101/2024.06.09.598125. bioRxiv. 2024. PMID: 38915673 Free PMC article. Preprint.
References
-
- Bradbury R, Brodney MA. Alzheimer’s Disease Topics in Medicinal Chemistry. Springer Berlin; Heidelberg; 2007.
Publication types
MeSH terms
Substances
LinkOut - more resources
Full Text Sources
Other Literature Sources
Medical
Miscellaneous
