. 2016 Apr 12;15(2):349-59.
doi: 10.1016/j.celrep.2016.03.021. Epub 2016 Mar 31.

Integrated Regulation of Hepatic Lipid and Glucose Metabolism by Adipose Triacylglycerol Lipase and FoxO Proteins

Affiliations

Integrated Regulation of Hepatic Lipid and Glucose Metabolism by Adipose Triacylglycerol Lipase and FoxO Proteins

Wenwei Zhang et al. Cell Rep. .

Abstract

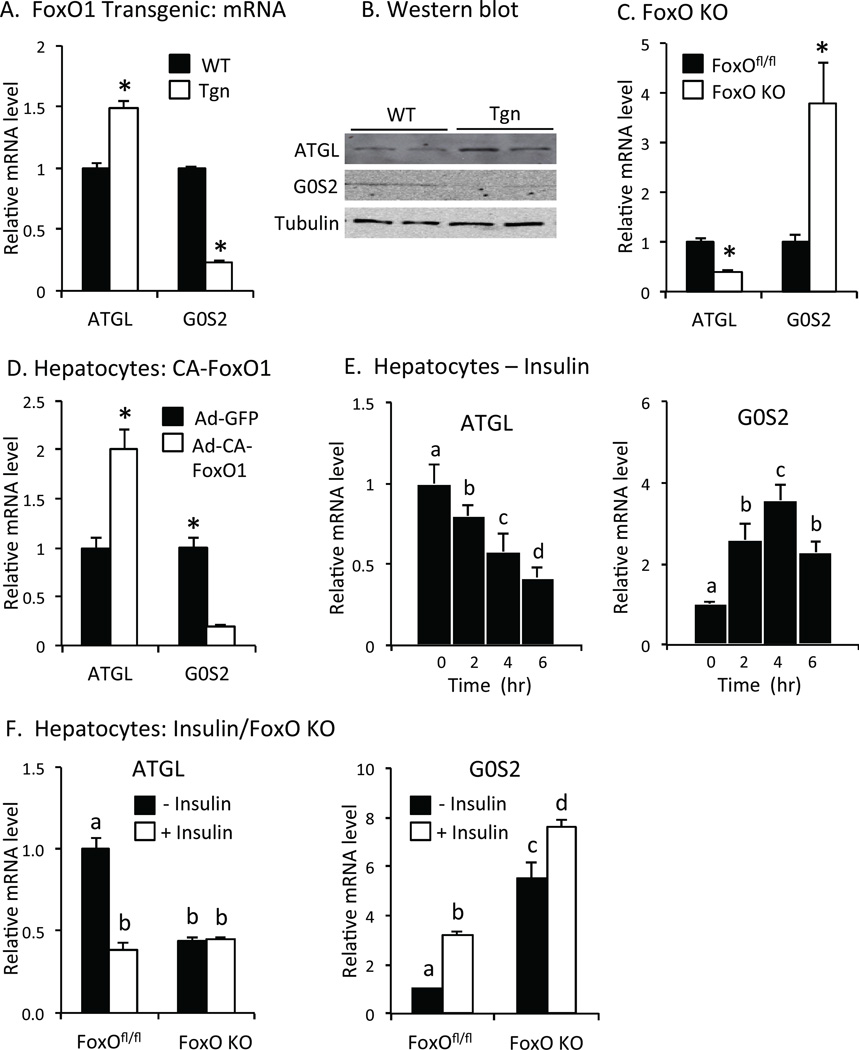
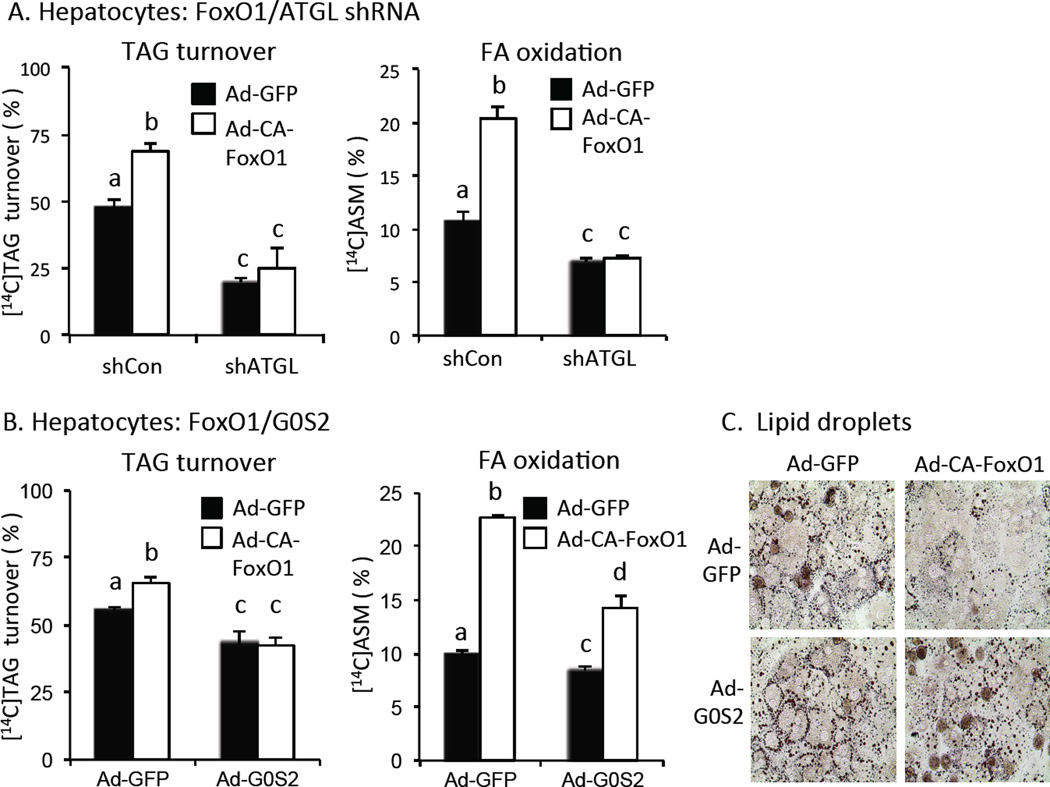
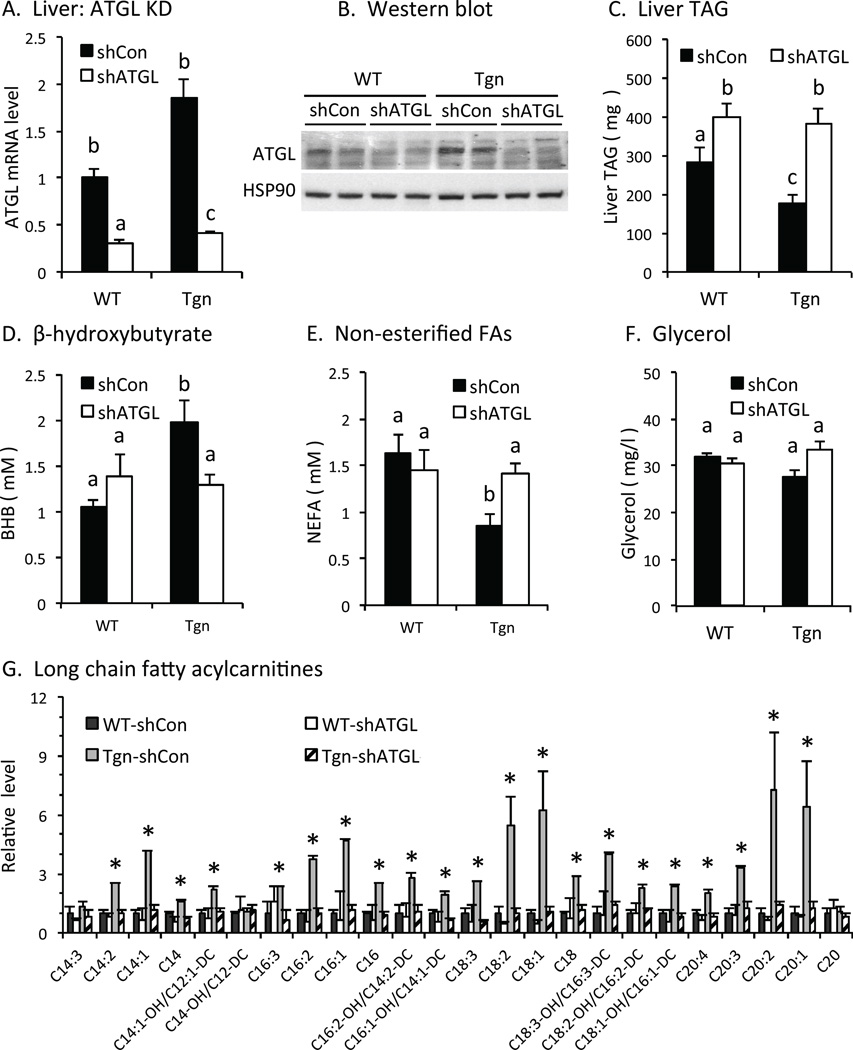
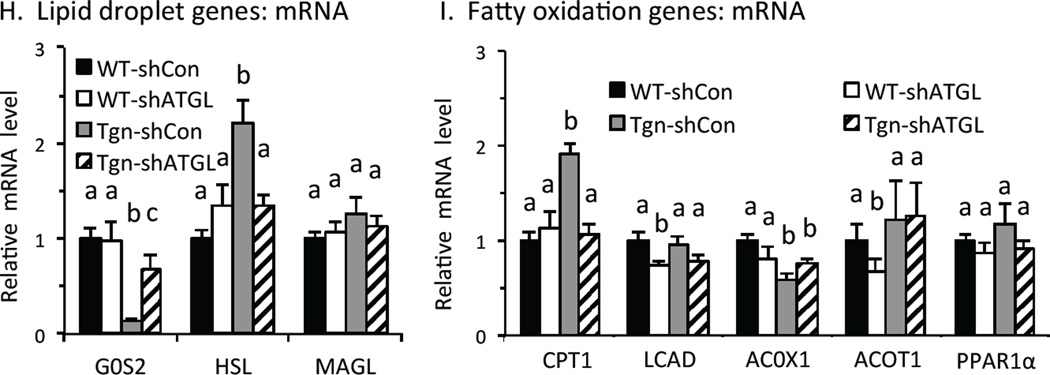
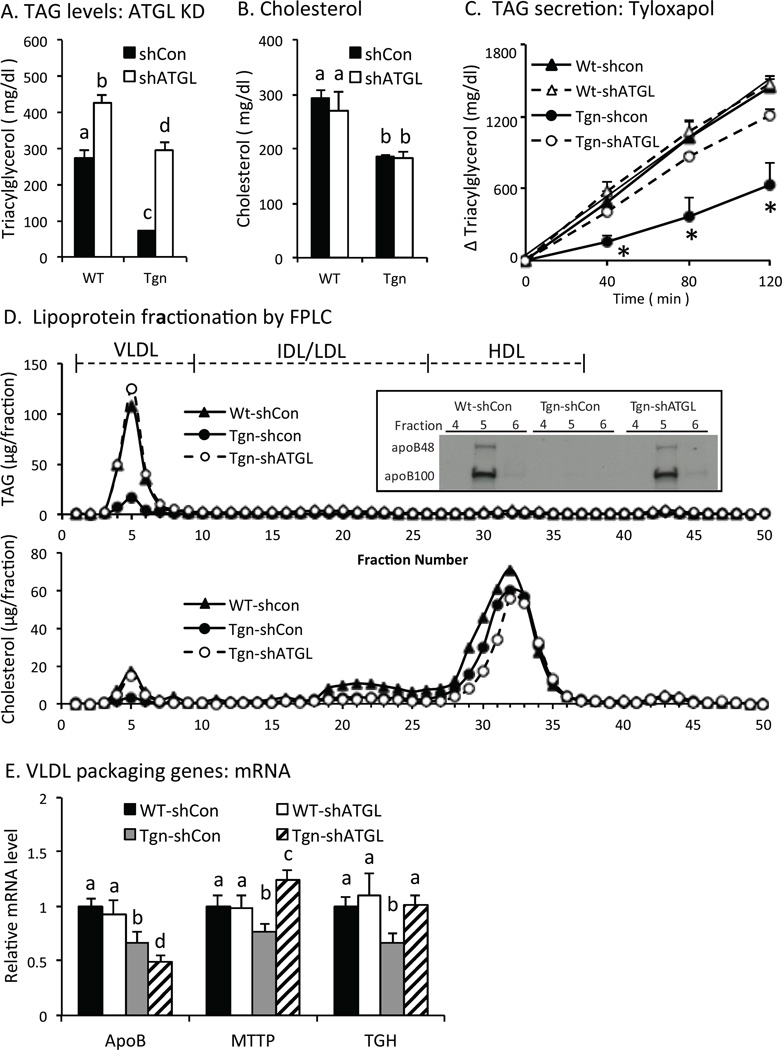
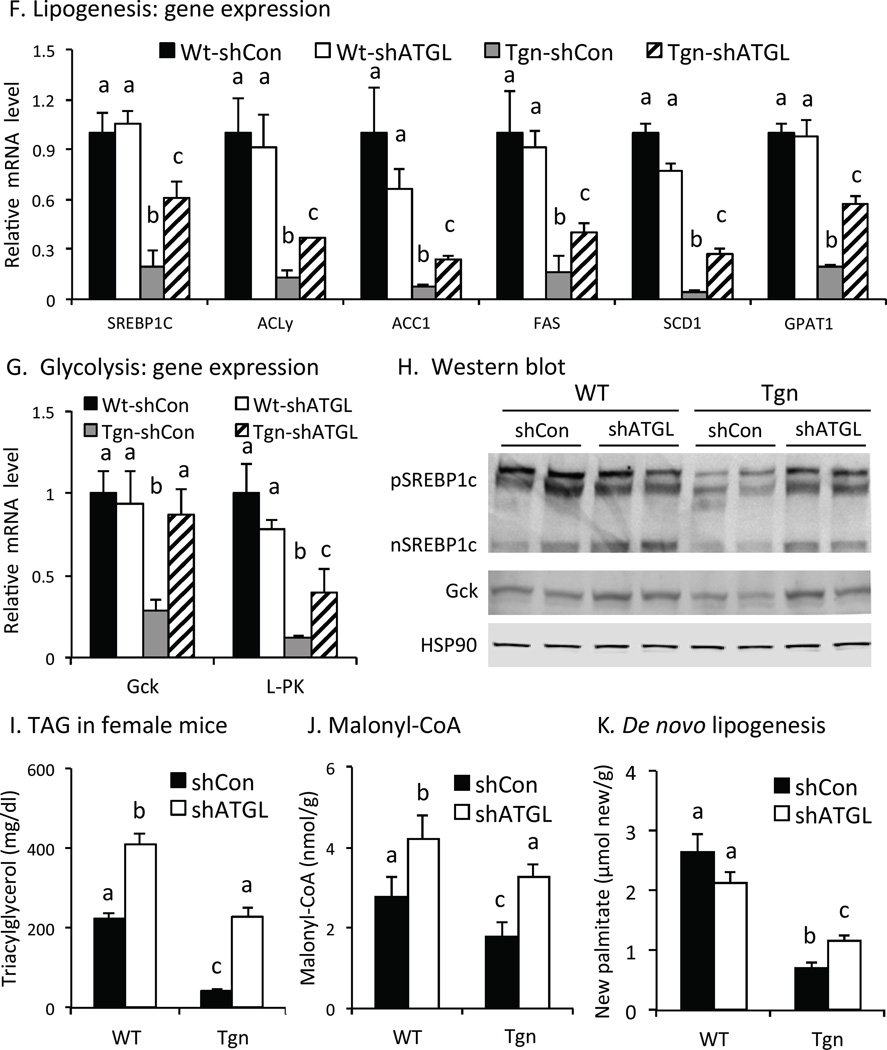
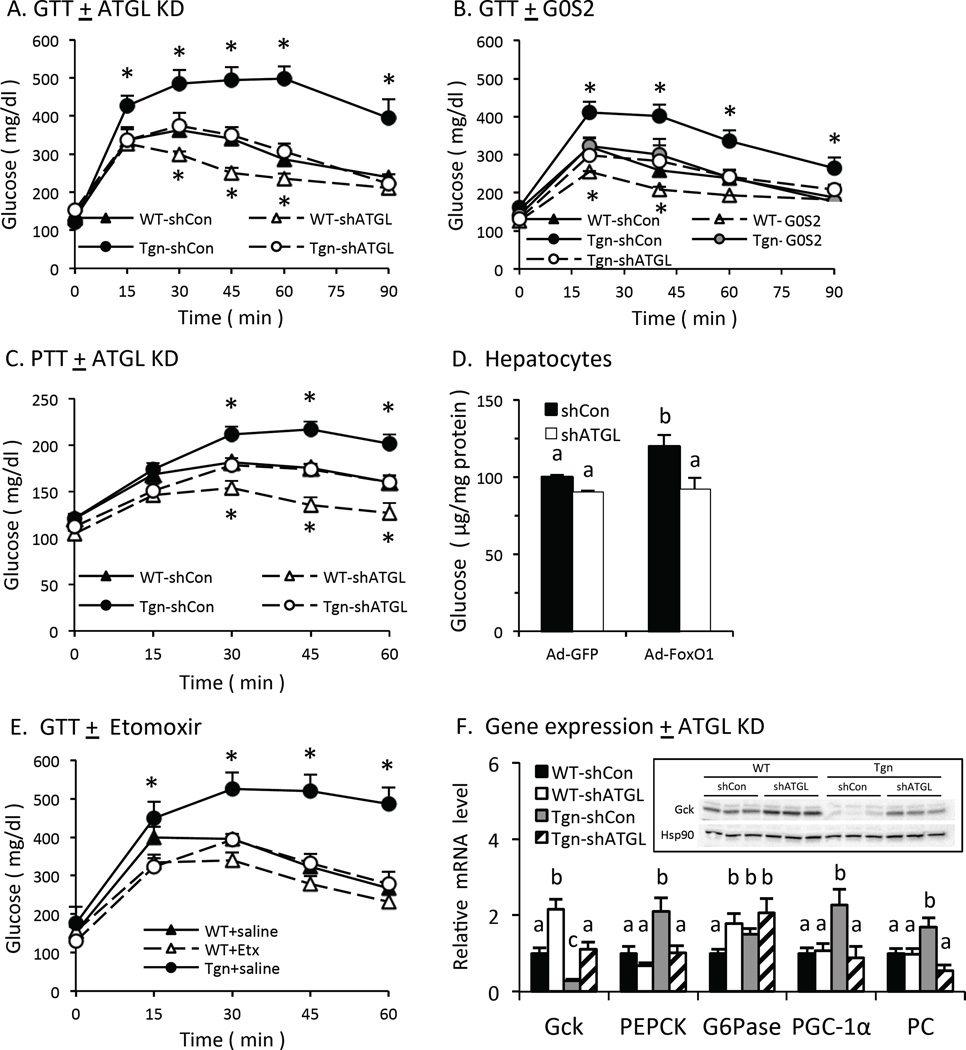
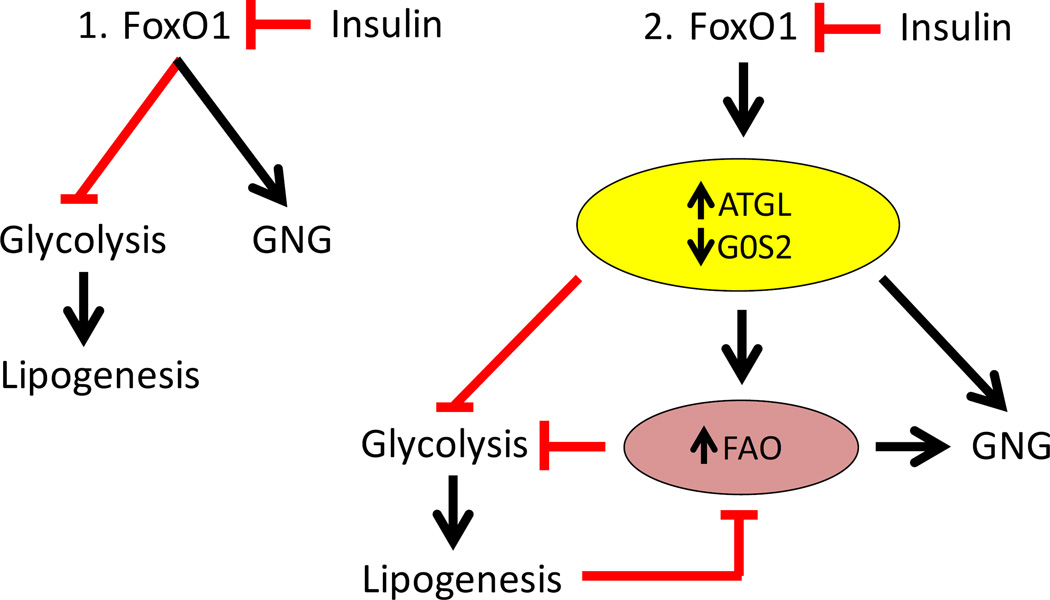
Metabolism is a highly integrated process that is coordinately regulated between tissues and within individual cells. FoxO proteins are major targets of insulin action and contribute to the regulation of gluconeogenesis, glycolysis, and lipogenesis in the liver. However, the mechanisms by which FoxO proteins exert these diverse effects in an integrated fashion remain poorly understood. We report that FoxO proteins also exert important effects on intrahepatic lipolysis and fatty acid oxidation via the regulation of adipose triacylglycerol lipase (ATGL), which mediates the first step in lipolysis, and its inhibitor, the G0/S1 switch 2 gene (G0S2). We also find that ATGL-dependent lipolysis plays a critical role in mediating diverse effects of FoxO proteins in the liver, including effects on gluconeogenic, glycolytic, and lipogenic gene expression and metabolism. These results indicate that intrahepatic lipolysis plays a critical role in mediating and integrating the regulation of glucose and lipid metabolism downstream of FoxO proteins.


Figures

Fig. 1
Fig. 1. ATGL and G0S2 gene expression
A. FoxO1 transgenic mice. Relative ATGL and G0S2 mRNA levels in liver of wild type (WT, solid bar) and FoxO1 transgenic (Tgn, open bar) 6 hr after refeeding (n = 4–6). B. Western blot. ATGL, G0S2 and tubulin proteins in liver were measured by western blot in refed WT and Tgn mice. C. FoxO KO mice. Relative ATGL and G0S2 mRNA levels in FoxOfl/fl (solid bar) and FoxO KO (open bar) mice (n = 5). D. Effects of FoxO1 in hepatoctyes. Relative ATGL and G0S2 mRNA levels in primary hepatocytes from wild type mice transfected with adenovirus expressing constitutively active FoxO1 (Ad-CA-FoxO1, open bar) or green fluorescent protein (Ad-GFP, solid bar) (n = 4). E. Regulation by insulin. ATGL (left panel) and G0S2 (right panel) mRNA levels in primary hepatocytes treated with/without 100 nM insulin (n = 3). F. FoxO KO hepatocytes. ATGL (left) and G0S2 (right) mRNA levels were measured in hepatocytes isolated from FoxOfl/fl or FoxO KO mice following 4 hr treatment with (open bar) or without insulin (n = 3). Statistical significance (P<0.05) was determined by Student’s t test (*) or ANOVA, where bars with unlike letters differ. Mean + SEM.
Fig. 2
Fig. 2. TAG catabolism in hepatocytes
A. ATGL-dependent effects of FoxO1. TAG turnover (left panel) and fatty acid oxidation (accumulation of acid soluble metabolites (ASM) in hepatocyte conditioned medium) (right panel) were measured in [1-14C]oleate-loaded hepatocytes following transfection adenovirus expressing control/scrambled shRNA or ATGL shRNA plus adenovirus expressing CA-FoxO1 (open bars) or GFP (solid bars) (n = 3). B. Co-expression of G0S2. TAG turnover (left panel) and fatty acid oxidation (right panel) in hepatocytes transfected with adenovirus ATGL shRNA or control/scrambled shRNA plus adenovirus expressing CA-FoxO1 (open bars) or GFP (solid bars) (n = 3). C. Lipid droplets. Hepatocytes expressing CA-FoxO1 or GFP plus G0S2 or GFP were stained with Oil red O to visualize lipid droplets. Statistical significance (P<0.05) was determined by ANOVA, where bars with unlike letters differ. Mean + SEM.
Fig. 3
Fig. 3. TAG catabolism in liver
A. ATGL knockdown in vivo. ATGL mRNA levels were measured in liver in wildtype (WT) and transgenic (Tgn) mice 7 d after tail vein injection with adenovirus expressing control/scrambled shRNA (shCON, solid bars) or ATGL shRNA (shATGL, open bars) or (n = 4–5). B. Western blot. ATGL protein level in liver from WT and Tgn mice w/wo ATGL KD. C. Liver TAG. TAG in refed WT and Tgn mice 7 d after ATGL KD (n = 4–5). D-F. Plasma levels of β-hydroxybutyrate (D), non-esterified fatty acids (E) and glycerol (F). Plasma was collected from briefly (4-hr) fasted mice from WT and Tgn mice 5 days after treatment with control (solid bar) or shATGL (open bar) adenovirus. Plasma BHB levels in 4-hr fasted WT and Tgn mice 5 d post ATGL KD (n = 6–8). G. Fatty acylcarnitines. Long chain fatty acyl carnitines in liver from refed WT and Tgn mice 7 d after treatment with adenovirus expressing scrambled/control or ATGL shRNA (n = 4–5). H. Lipid droplet genes. Relative level of G0S2, hormone sensitive lipase (HSL) and monoacylglycerol lipase (MAGL) mRNA in WT and Tgn mice 7d post ATGL shRNA or control adenovirus treatment (n = 4–5). I. Fatty acid oxidation genes. Carnitine palmitoyltransferase-1 (CPT-1), very long chain acyl-CoA dehydrogenase (LCAD), acyl-CoA oxidase (ACOX1), acyl-CoA thioesterase1 (ACOT1) and PPARα mRNA levels 7 d post treatment with ATGL shRNA or control adenovirus are shown (n = 4–5). Statistical significance (P<0.05) was determined by ANOVA, where bars with unlike letters differ, or Student’s t test (*). Mean + SEM.
Fig. 4
Fig. 4. Lipid levels and lipogenesis
A. Serum TAG levels in refed male WT and Tgn mice w/wo ATGL knock down (KD) (n = 4–5). B. Cholesterol levels in refed mice w/wo ATGL KD (n = 4–5). C. Hepatic TAG secretion. WT and Tgn mice w/wo ATGL KD were treated with Tyloxapol 4 hr after refeeding. Plasma TAG level was determined 0, 40, 80 and 120 min after Tyloxapol treatment, and change in TAG level is shown. (n = 4) D. Lipoprotein fractionation. Plasma from refed WT and Tgn mice w/wo ATGL KD was fractionated by FPLC and TAG (upper panel) and cholesterol (lower panel) content was determined in FPLC fractions. Average values are shown for two samples from each group. Insert. Western blot of apolipoprotein B in FPLC fractions 4–6 is shown. E. VLDL packaging genes. Liver apoB, microsomal triglyceride transfer protein (MTTP), and triacylglycerol hydrolase (TGH) mRNA levels in refed mice 7 d post ATGL KD are shown (n = 4–5). F. Lipogenic genes. Liver SREBP-1c, ATP citrate lyase, acetyl-CoA carboxylase, fatty acid synthase, stearoyl-CoA desaturase-1, and glycerol-3-phosphate acyltransferase-1 mRNA levels in refed mice are shown (n = 4–5). G. Glycolytic genes. Liver mRNA levels for Gck and pyruvate kinase in refed mice (n = 4–5). H. Western blot. Liver SREBP-1c, Gck and tubulin protein levels in refed mice. I-K. Lipogenesis. Plasma TAG levels (I), and malonyl-CoA in liver (J) were measured in refed female WT and Tgn mice 7 d after treatment with adenovirus expressing ATGL shRNA or control/scrambled shRNA. Deuterated water was administered 2 hr after refeeding and tissue was harvested 4 hr later for determination of newly synthesized palmitate in liver (K) (n = 4–5). Statistical significance (P<0.05) was determined by ANOVA, where bars with unlike letters differ. Mean + SEM.
Fig. 5
Fig. 5. Glucose tolerance and glucose production
A. Glucose tolerance:ATGL KD. Glucose tolerance tests were performed in 4-hr fasted WT and Tgn male mice 5 d after treatment with adenovirus expressing ATGL shRNA or control shRNA (n = 4–5). B. Glucose tolerance:G0S2 expression. GTTs were performed in 4-hr fasted WT and Tgn female mice 5 d after treatment with adenovirus expressing G0S2 or GFP (control) (n = 4–5). C. Pyruvate tolerance. Pyruvate tolerance tests were performed in 4-hr fasted WT and Tgn mice 5 d post ATGL KD (n = 4–5). D. Hepatocytes. Production of glucose from pyruvate and lactate was measured in hepatocytes co-transfected with adenovirus expressing CA-FoxO1 or GFP, plus adenovirus expressing ATGL shRNA (open bars) or control shRNA (solid bars) (n = 3–4). E. Etomoxir. GTTs in 4-hr fasted WT and Tgn mice 30 min after treatment with etomoxir or PBS (n = 4–6). F. Gene expression. PEPCK, G6Pase, PGC-1α and PC mRNA levels in liver from refed mice 5 d after treatment with adenovirus expression ATGL shRNA or control shRNA (n = 4). Statistical significance (P<0.05) was determined by Student’s t test (*) or ANOVA, where bars with unlike letters differ. Mean + SEM.
Fig. 6
Fig. 6. Integrated regulation of glucose and lipid metabolism by FoxO proteins and ATGL-dependent TAG hydrolysis
1. Previous studies have shown that FoxO proteins suppress glycolytic/lipogenic metabolism and promote gluconeogenic metabolism in the liver, and that insulin disrupts this effect of FoxO proteins. 2. FoxO proteins promote ATGL and suppress G0S2 expression, and promote intrahepatic lipolysis and FAO in an ATGL-dependent fashion. In addition to direct effects of FoxO proteins on gene expression, ATGL-dependent mechanisms also contribute to effects of FoxO proteins on reduced glycolytic/lipogenic and increased gluconeogenic gene expression and metabolism. Increased FAO promotes gluconeogenesis (GNG) and suppresses glycolytic/lipogenic metabolism downstream from FoxO1 and ATGL. At the same time, reduced glycolysis and synthesis of malonyl-CoA may promote FAO.

Similar articles

Cited by

References

    1. An J, Muoio DM, Shiota M, Fujimoto Y, Cline GW, Shulman GI, Koves TR, Stevens R, Millington D, Newgard CB. Hepatic expression of malonyl-CoA decarboxylase reverses muscle, liver and whole-animal insulin resistance. Nature medicine. 2004;10:268–274. - PubMed
    1. Brown JM, Betters JL, Lord C, Ma Y, Han X, Yang K, Alger HM, Melchior J, Sawyer J, Shah R, et al. CGI-58 knockdown in mice causes hepatic steatosis but prevents diet-induced obesity and glucose intolerance. J Lipid Res. 2010;51:3306–3315. - PMC - PubMed
    1. Brunet A, Bonni A, Zigmond MJ, Lin MZ, Juo P, Hu LS, Anderson MJ, Arden KC, Blenis J, Greenberg ME. Akt promotes cell survival by phosphorylating and inhibiting a Forkhead transcription factor. Cell. 1999;96:857–868. - PubMed
    1. Bu SY, Mashek MT, Mashek DG. Suppression of long chain acyl-CoA synthetase 3 decreases hepatic de novo fatty acid synthesis through decreased transcriptional activity. The Journal of biological chemistry. 2009;284:30474–30483. - PMC - PubMed
    1. Chakrabarti P, Kandror KV. FoxO1 controls insulin-dependent adipose triglyceride lipase (ATGL) expression and lipolysis in adipocytes. The Journal of biological chemistry. 2009;284:13296–13300. - PMC - PubMed

Publication types

MeSH terms

LinkOut - more resources