. 2016 Apr 12;15(2):238-46.
doi: 10.1016/j.celrep.2016.03.028. Epub 2016 Mar 31.

Evidence for an Age-Dependent Decline in Axon Regeneration in the Adult Mammalian Central Nervous System

Affiliations

Evidence for an Age-Dependent Decline in Axon Regeneration in the Adult Mammalian Central Nervous System

Cédric G Geoffroy et al. Cell Rep. .

Abstract

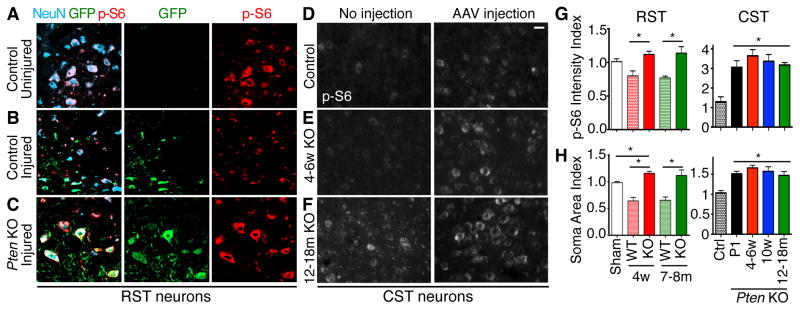
How aging impacts axon regeneration after CNS injury is not known. We assessed the impact of age on axon regeneration induced by Pten deletion in corticospinal and rubrospinal neurons, two neuronal populations with distinct innate regenerative abilities. As in young mice, Pten deletion in older mice remains effective in preventing axotomy-induced decline in neuron-intrinsic growth state, as assessed by mTOR activity, neuronal soma size, and axonal growth proximal to a spinal cord injury. However, axonal regeneration distal to injury is greatly diminished, accompanied by increased expression of astroglial and inflammatory markers at the injury site. Thus, the mammalian CNS undergoes an age-dependent decline in axon regeneration, as revealed when neuron-intrinsic growth state is elevated. These results have important implications for developing strategies to promote axonal repair after CNS injuries or diseases, which increasingly affect middle-aged to aging populations.


Figures

Figure 1
Figure 1. The effect of age on CST regeneration in Pten deleted mice after T8 dorsal hemisection spinal cord injury
(A–E′) Representative images of spinal cord sagittal sections showing BDA-labeled CST axons around the injury site (marked with an arrow) from control (Ctrl) or Pten deleted mice (KO). P1 (postnatal day 1), 4–6 week, 10 week and 12–18 month refer to the age at which Pten deletion was initiated by AAV-Cre injection into the right sensorimotor cortex of PTENf/f mice. AAV-GFP injection served as the control. Scale bars = 200 μm. Caudal is always to the right in this and all other spinal cord images. (F) Quantification of rostral CST axon labeling, including controls for the P1, 4–6 week and 12 month groups. (G) Quantification of caudal CST axon regeneration. The data for controls were zeros or close to zeros with essentially no error bars. Two-way ANOVA followed by Bonferroni’s post hoc test, *P < 0.05, **P < 0.01, ***P < 0.001. Green *, P1 and 4–6w vs. 12–18m; green @, P1 vs. 12–18m; blue *, P1 and 4–6w vs. 10w; blue @, P1 vs. 10w. N = 14 (P1 Ctrl); 8 (4–6 week Ctrl); 5 (12–18 month Ctrl); 11 (P1 KO); 14 (4–6 week KO); 4 (10 week KO); 12 (12–18 month KO). (H) Cumulative Axon Number Index observed past 0.75 mm caudal to injury. See also Figure S1.
Figure 2
Figure 2. The effect of age on RST regeneration in Pten deleted mice after C4 dorsolateral funiculus crush spinal cord injury
(A–D″) Representative images of spinal cord horizontal sections showing GFP-labeled RST axons around the injury site (arrow) from control (Ctrl) or Pten deleted mice (KO). 4 week and 7–8 month refer to the age at which Pten deletion was initiated by AAV-Cre-GFP injection into the right red nucleus of Ptenf/f mice. Panels A′, B′, C′, and D′ are 160 μm ventral to A, B, C, and D respectively, while panels A″, B″, C″, and D″ are 320 μm ventral to A, B, C, and D respectively. AAV-GFP injection served as the control. Here we include a 7–8m KO animal with relatively higher GFP labeling (D) to exemplify the lack of caudal axon growth in aged Pten KO animals. Scale bar = 200 μm. (E) Quantification of RST axon labeling rostral to and at (0.0 mm) the injury site. Two-way ANOVA followed by Bonferroni’s post hoc test, *P < 0.05, Black *, 4w and 7–8m KO vs. 4w and 7–8m WT. (F) Quantification of caudal RST axon regeneration. Two-way ANOVA followed by Bonferroni’s post hoc test, **P < 0.01, Red **, 4w KO vs. 7–8 m KO, 4w WT, and 7–8m WT. (G) Axon Number Index observed at the middle of the injury site. This is the same information shown at 0.0 mm from injury site in (E). (H) Cumulative Axon Number Index observed at ≥1 mm caudal to the injury site. N = 8 (4w WT); 8 (7–8m WT); 8 (4w KO); 8 (7–8m KO). See also Figure S1.
Figure 3
Figure 3. Pten deletion prevents axotomy-induced reduction of mTOR signaling and soma size in rubrospinal and corticospinal neurons independently of age
(AC) Representative transverse sections through magnocellular red nucleus showing NeuN+ rubrospinal neurons stained for p-S6 and GFP in young uninjured control (A), young injured control (B) and old injured Pten KO (c) mice. (D–F) Representative coronal sections of layer 5 sensorimotor cortex showing cortical neurons stained for p-S6. In Pten KO mice, AAV-Cre injected side would have Pten deletion. (G, H) Quantification of p-S6 immunoreactivity (G) and soma size (H) for rubral and layer V cortical neurons. For rubrospinal neurons, WT (GFP negative) and KO (GFP positive) values represent intermingled Pten non-deleted and deleted neurons, respectively, within the same injected and injured red nucleus based on NeuN staining. Scale bars = 25 μm. One-way ANOVA, Bonferroni’s post hoc test, *P < 0.05. See also Figures S2 and S3.
Figure 4
Figure 4. Aging is associated with increased expression of astroglial and inflammatory markers around the spinal cord injury site
(A–D) Representative images and quantification (normalized to 1.5 mm rostral) of GFAP, CS-56 and Nogo-A immunoreactivity 6 weeks after dorsal hemisection (DH) injury in mice of different ages. (E–G) Representative images and quantification (normalized to the contralateral side) of GFAP and CS-56 immunoreactivity 8 weeks after dorsolateral funiculus (DLF) crush injury in mice of different ages. (H–J) Immunoreactivity and cell counts with microglia and macrophage marker CD68 after dorsal hemisection injury in mice of different ages. Scale bars = 200 μm (A–B′, E–F′, H–I); 20 μm (A1–B4, E1–F4, H′–I″). Student’s t-test, *P < 0.05. See also Figure S4.

References

    1. Anderson MA, Ao Y, Sofroniew MV. Heterogeneity of reactive astrocytes. Neurosci Lett. 2014;565:23–29. - PMC - PubMed
    1. Badan I, Buchhold B, Hamm A, Gratz M, Walker LC, Platt D, Kessler C, Popa-Wagner A. Accelerated glial reactivity to stroke in aged rats correlates with reduced functional recovery. J Cereb Blood Flow Metab. 2003;23:845–854. - PubMed
    1. Benowitz LI, Popovich PG. Inflammation and axon regeneration. Curr Opin Neurol. 2011;24:577–583. - PubMed
    1. Blesch A, Tuszynski MH. Spinal cord injury: plasticity, regeneration and the challenge of translational drug development. Trends Neurosci. 2009;32:41–47. - PubMed
    1. Bradke F, Marin O. Editorial overview: development and regeneration: nervous system development and regeneration. Curr Opin Neurobiol. 2014;27:iv–vi. - PubMed

Publication types

MeSH terms