

mTOR transcriptionally and post-transcriptionally regulates Npm1 gene expression to contribute to enhanced proliferation in cells with Pten inactivation
- PMID: 27050906
- PMCID: PMC4889308
- DOI: 10.1080/15384101.2016.1166319
mTOR transcriptionally and post-transcriptionally regulates Npm1 gene expression to contribute to enhanced proliferation in cells with Pten inactivation
Abstract
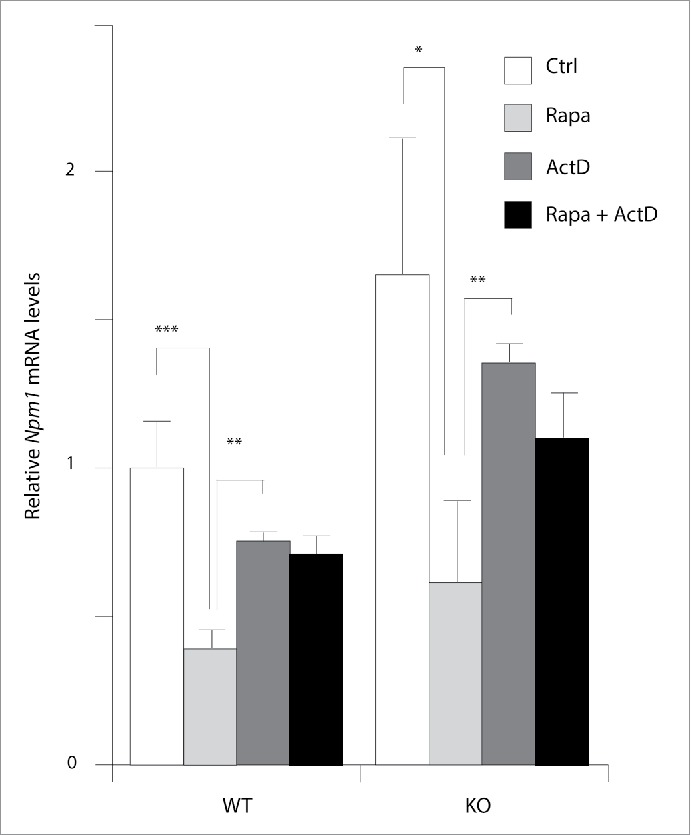
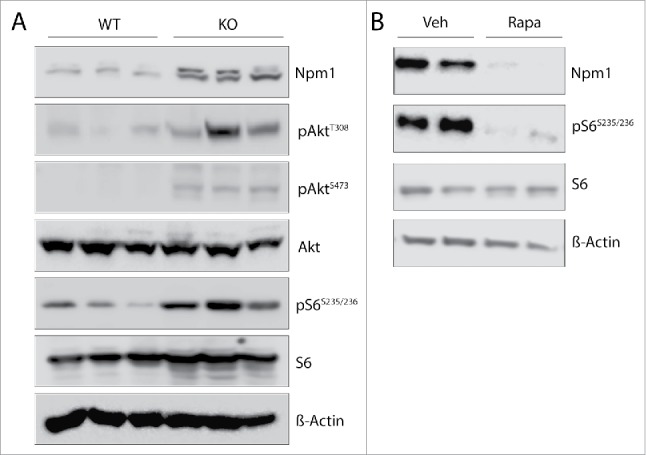
The mammalian target of rapamycin (mTOR) plays essential roles in the regulation of growth-related processes such as protein synthesis, cell sizing and metabolism in both normal and pathological growing conditions. These functions of mTOR are thought to be largely a consequence of its cytoplasmic activity in regulating translation rate, but accumulating data highlight supplementary role(s) for this serine/threonine kinase within the nucleus. Indeed, the nuclear activities of mTOR are currently associated with the control of protein biosynthetic capacity through its ability to regulate the expression of gene products involved in the control of ribosomal biogenesis and proliferation. Using primary murine embryo fibroblasts (MEFs), we observed that cells with overactive mTOR signaling displayed higher abundance for the growth-associated Npm1 protein, in what represents a novel mechanism of Npm1 gene regulation. We show that Npm1 gene expression is dependent on mTOR as demonstrated by treatment of wild-type and Pten inactivated MEFs cultured with rapamycin or by transient transfections of small interfering RNA directed against mTOR. In accordance, the mTOR kinase localizes to the Npm1 promoter gene in vivo and it enhances the activity of a human NPM1-luciferase reporter gene providing an opportunity for direct control. Interestingly, rapamycin did not dislodge mTOR from the Npm1 promoter but rather strongly destabilized the Npm1 transcript by increasing its turnover. Using a prostate-specific Pten-deleted mouse model of cancer, Npm1 mRNA levels were found up-regulated and sensitive to rapamycin. Finally, we also showed that Npm1 is required to promote mTOR-dependent cell proliferation. We therefore proposed a model whereby mTOR is closely involved in the transcriptional and posttranscriptional regulation of Npm1 gene expression with implications in development and diseases including cancer.
Keywords: Npm1; cell proliferation; gene expression; mTOR; prostate cancer.
Figures


Similar articles
-
High glucose-induced hypertrophy of mesangial cells is reversed by connexin43 overexpression via PTEN/Akt/mTOR signaling.Nephrol Dial Transplant. 2012 Jan;27(1):90-100. doi: 10.1093/ndt/gfr265. Epub 2011 Jun 1. Nephrol Dial Transplant. 2012. PMID: 21633095
-
Threonine-120 phosphorylation regulated by phosphoinositide-3-kinase/Akt and mammalian target of rapamycin pathway signaling limits the antitumor activity of mammalian sterile 20-like kinase 1.J Biol Chem. 2012 Jul 6;287(28):23698-709. doi: 10.1074/jbc.M112.358713. Epub 2012 May 22. J Biol Chem. 2012. PMID: 22619175 Free PMC article.
-
AP-1 regulates cyclin D1 and c-MYC transcription in an AKT-dependent manner in response to mTOR inhibition: role of AIP4/Itch-mediated JUNB degradation.Mol Cancer Res. 2011 Jan;9(1):115-30. doi: 10.1158/1541-7786.MCR-10-0105. Epub 2010 Dec 6. Mol Cancer Res. 2011. PMID: 21135252 Free PMC article.
-
Targeting the translational apparatus to improve leukemia therapy: roles of the PI3K/PTEN/Akt/mTOR pathway.Leukemia. 2011 Jul;25(7):1064-79. doi: 10.1038/leu.2011.46. Epub 2011 Mar 25. Leukemia. 2011. PMID: 21436840 Review.
-
The role of mechanistic target of rapamycin (mTOR) complexes signaling in the immune responses.Nutrients. 2013 Jun 19;5(6):2231-57. doi: 10.3390/nu5062231. Nutrients. 2013. PMID: 23783557 Free PMC article. Review.
Cited by
-
Perturbation of RNA Polymerase I transcription machinery by ablation of HEATR1 triggers the RPL5/RPL11-MDM2-p53 ribosome biogenesis stress checkpoint pathway in human cells.Cell Cycle. 2018;17(1):92-101. doi: 10.1080/15384101.2017.1403685. Epub 2017 Dec 10. Cell Cycle. 2018. PMID: 29143558 Free PMC article.
-
Microarray analysis and functional prediction of differentially expressed circular RNAs in acquired middle ear cholesteatoma.Biomed Eng Online. 2021 Dec 18;20(1):129. doi: 10.1186/s12938-021-00960-x. Biomed Eng Online. 2021. PMID: 34922560 Free PMC article.
-
O-GlcNAc Transferase Inhibition Differentially Affects Breast Cancer Subtypes.Sci Rep. 2019 Apr 5;9(1):5670. doi: 10.1038/s41598-019-42153-6. Sci Rep. 2019. PMID: 30952976 Free PMC article.
-
The Novel Imiqualine EAPB02303 Is a Potent Drug for Treating Acute Myeloid Leukemia.Biomolecules. 2025 May 20;15(5):741. doi: 10.3390/biom15050741. Biomolecules. 2025. PMID: 40427634 Free PMC article.
-
Proregenerative extracellular matrix hydrogel mitigates pathological alterations of pelvic skeletal muscles after birth injury.Sci Transl Med. 2023 Aug 2;15(707):eabj3138. doi: 10.1126/scitranslmed.abj3138. Epub 2023 Aug 2. Sci Transl Med. 2023. PMID: 37531414 Free PMC article.
References
-
- Aramburu J, Ortells MC, Tejedor S, Buxade M, Lopez-Rodriguez C. Transcriptional regulation of the stress response by mTOR. Sci Signal 2014; 7:re2; PMID:24985347; http://dx.doi.org/10.1126/scisignal.2005326 - DOI - PubMed
-
- Laplante M, Sabatini DM. mTOR signaling in growth control and disease. Cell 2012; 149:274-93; PMID:22500797; http://dx.doi.org/10.1016/j.cell.2012.03.017 - DOI - PMC - PubMed
-
- Hara K, Maruki Y, Long X, Yoshino K, Oshiro N, Hidayat S, Tokunaga C, Avruch J, Yonezawa K. Raptor, a binding partner of target of rapamycin (TOR), mediates TOR action. Cell 2002; 110:177-89; PMID:12150926; http://dx.doi.org/10.1016/S0092-8674(02)00833-4 - DOI - PubMed
-
- Sarbassov DD, Ali SM, Kim DH, Guertin DA, Latek RR, Erdjument-Bromage H, Tempst P, Sabatini DM. Rictor, a novel binding partner of mTOR, defines a rapamycin-insensitive and raptor-independent pathway that regulates the cytoskeleton. Curr Biol 2004; 14:1296-302; PMID:15268862; http://dx.doi.org/10.1016/j.cub.2004.06.054 - DOI - PubMed
-
- Ma XM, Blenis J. Molecular mechanisms of mTOR-mediated translational control. Nat Rev Mol Cell Biol 2009; 10:307-18; PMID:19339977; http://dx.doi.org/10.1038/nrm2672 - DOI - PubMed
MeSH terms
Substances
LinkOut - more resources
Full Text Sources
Other Literature Sources
Research Materials
Miscellaneous