. 2016 Apr 7:7:11115.
doi: 10.1038/ncomms11115.

Genetic and environmental influences interact with age and sex in shaping the human methylome

Collaborators, Affiliations

Genetic and environmental influences interact with age and sex in shaping the human methylome

Jenny van Dongen et al. Nat Commun. .

Abstract

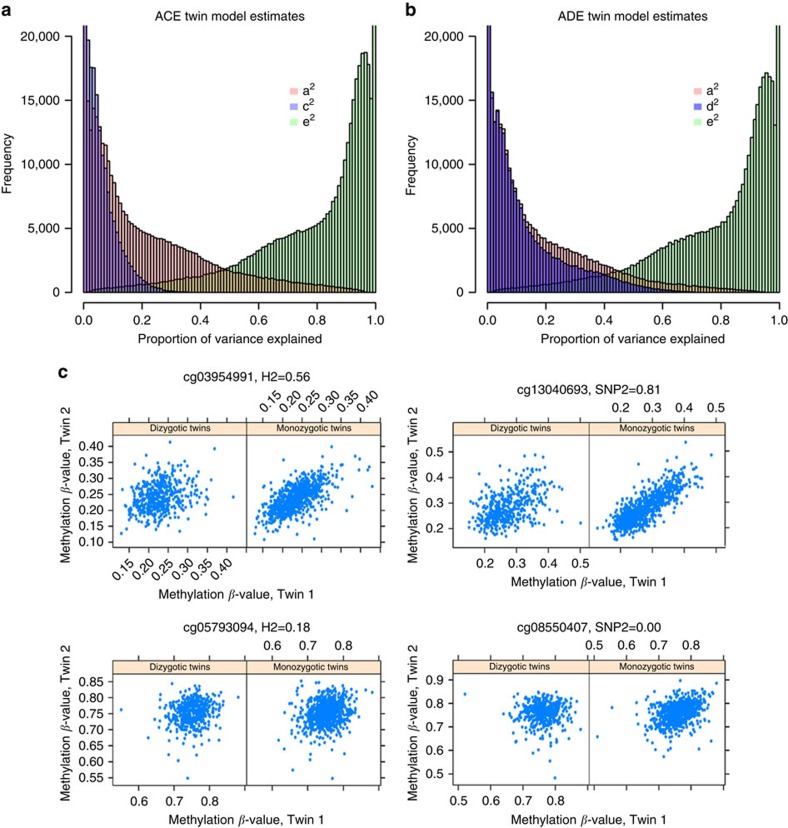
The methylome is subject to genetic and environmental effects. Their impact may depend on sex and age, resulting in sex- and age-related physiological variation and disease susceptibility. Here we estimate the total heritability of DNA methylation levels in whole blood and estimate the variance explained by common single nucleotide polymorphisms at 411,169 sites in 2,603 individuals from twin families, to establish a catalogue of between-individual variation in DNA methylation. Heritability estimates vary across the genome (mean=19%) and interaction analyses reveal thousands of sites with sex-specific heritability as well as sites where the environmental variance increases with age. Integration with previously published data illustrates the impact of genome and environment across the lifespan at methylation sites associated with metabolic traits, smoking and ageing. These findings demonstrate that our catalogue holds valuable information on locations in the genome where methylation variation between people may reflect disease-relevant environmental exposures or genetic variation.


Figures

Figure 1
Figure 1. Genetic and environmental influences on genome-wide DNA methylation levels.
Estimates from classical twin modelling in 769 MZ and 424 DZ twin pairs. (a) Histograms of genome-wide ACE model estimates: variance explained by additive genetic effects (a2, red), common environmental effects (c2, purple) and unique environmental effects (e2, green). (b) Histograms of genome-wide ADE model estimates: variance explained by additive genetic effects (a2, red), non-additive genetic effects (d2, dark purple) and unique environmental effects (e2, green). Y axes are truncated. (c) Scatterplots of DNA methylation levels in MZ and DZ twin pairs at four exemplary CpG sites. The DNA methylation level in twin 2 (y axis) is plotted against the DNA methylation level in twin 1 (x axis) for all MZ twin pairs and all DZ twin pairs. For illustrative purposes, methylation β-values (which represent methylation proportion) obtained after normalization are plotted in this figure, whereas all analyses were performed on normalized methylation M values, corrected for a number of covariates (see Methods section). Four examples of CpG sites were selected from the most variable CpG sites (s.d.>0.03) with high heritability (h2=0.56; upper left), high SNP heritability (h2SNPs=0.81; upper right), low heritability (h2=0.18; lower left) and low SNP heritability (h2SNPs=0.00, lower right). Note that the larger the difference between the correlation in MZ twins and in DZ twins (stronger correlation in MZ twins), the higher the total heritability. The resemblance of MZ and DZ twins is not informative with respect to the amount of variance explained by genome-wide SNPs. Additional examples are plotted in Supplementary Figs 10–13.
Figure 2
Figure 2. Heritability of DNA methylation level across the genome.
Estimates of DNA methylation heritability from the GRM-based approach in 2,603 individuals. From inside to outside: the most inner circular diagram displays the average methylation level at each site, the second band shows the total heritability of DNA methylation level, the third band shows the SNP heritability of DNA methylation level, and the most outer circle shows the chromosome ideograms. Colours range from dark blue (0%) to dark red (100%).
Figure 3
Figure 3. Variance explained by SNPs and longitudinal stability.
(a) Histogram of total additive heritability (h2 total) of DNA methylation (green) and variance explained by genome-wide SNPs (h2 SNPs, purple) for genome-wide CpGs. The y axis is truncated. (b) Density plot of methylation sites with a high versus low heritability. (c) Distribution of methylation sites grouped based on heritability and longitudinal stability relative to genes: DP, distal promoter; DS, downstream region; GB, gene body; IG, intergenic; PP, proximal promoter. (d) Distribution of methylation sites grouped based on heritability and longitudinal stability in relation to CpG density: CGI, CpG island; NC, non-CGI; SHE, CpG island shelf; SHO, CpG island shore. Asterisks denote significant enrichment or depletion (α=4.27 × 10⁻⁴, χ2-test). Results of DNA methylation heritability are from the GRM-based approach in 2,603 individuals. Longitudinal stability was assessed in 31 subjects with data from two longitudinally collected blood samples.
Figure 4
Figure 4. Main effects of age and sex and their interaction with genetic and environmental effects.
(a) Main and interaction effects of sex. The x axis denotes chromosomal position. The y axis denotes the β-value from the regression of methylation M value on sex (while correcting for age, white blood cell counts and technical covariates). Sites where the genetic variance showed significant sex interaction are indicated in blue. Sites where the environmental variance showed significant sex interaction are shown in green. The y axis is truncated at −1 and 1 to improve visibility, excluding a small number of sites with regression β-values up to −2.4 and 2.6. (b) Mean and interaction effects of age. The x axis denotes chromosomal position. The y axis denotes the β-value from the regression of methylation M value on age (while correcting for sex, white blood cell counts and technical covariates). Sites where the genetic variance showed significant age interaction are indicated in blue. Sites where the environmental variance showed significant age interaction are shown in green. Results are based on data from 2,603 individuals.
Figure 5
Figure 5. Heritability of DNA methylation at sites with significant interaction between age and genetic variance or age and environmental variance.
(a) Total variance of DNA methylation, additive genetic variance, unique environmental variance and heritability plotted against age, based on estimates obtained in interaction models on data from 2,603 individuals. (b) Histogram of heritability at age 25 (green) and at age 50 (purple) for 39,455 CpGs with significant interaction between age and genetic variance or between age and unique environmental variance. Dark blue denotes the overlap of green and purple bars.
Figure 6
Figure 6. Characteristics and overlap of sites showing interaction between age or sex and genetic or environmental variance.
(a) Venn diagram of the number of CpGs with significant interaction between sex and genetic variance (Sex × Va), between sex and unique environmental variance (Sex × Ve), between age and genetic variance (Age × Va) and between age and unique environmental variance (Age × Ve). (b) Density plot of CpGs with significant interaction effects. (c) Distribution of methylation sites with interaction effects relative to genes: DP, distal promoter; DS, downstream region; GB, gene body; IG, intergenic; PP, proximal promoter. (d) Distribution of methylation sites with interaction effects in relation to CpG density: CGI, CpG island; NC, non-CGI; SHE, CpG island shelf; SHO, CpG island shore. Asterisks denote significant enrichment or depletion (α=4.27 × 10⁻⁴, χ2-test). Results are based on data from 2,603 individuals.
Figure 7
Figure 7. Boxplots of the correlations between DNA methylation levels in smoking-concordant and smoking-discordant MZ twins.
Correlations are plotted for DNA methylation level at 65 CpGs that showed significant interaction between age and environmental variance and that were previously found to be associated with smoking. The boxes denote the 25th and 75th percentile (bottom and top of box), and median value (horizontal band inside box). The whiskers indicate the values observed within up to 1.5 times the interquartile range above and below the box.

References

    1. Meissner A. et al.. Genome-scale DNA methylation maps of pluripotent and differentiated cells. Nature 454, 766–770 (2008) . - PMC - PubMed
    1. Mill J. & Heijmans B. T. From promises to practical strategies in epigenetic epidemiology. Nat. Rev. Genet. 14, 585–594 (2013) . - PubMed
    1. Dick K. J. et al.. DNA methylation and body-mass index: a genome-wide analysis. Lancet 383, 1990–1998 (2014) . - PubMed
    1. Hidalgo B. et al.. Epigenome-wide association study of fasting measures of glucose, insulin, and HOMA-IR in the Genetics of Lipid Lowering Drugs and Diet Network study. Diabetes 63, 801–807 (2014) . - PMC - PubMed
    1. Liu Y. et al.. Epigenome-wide association data implicate DNA methylation as an intermediary of genetic risk in rheumatoid arthritis. Nat. Biotechnol. 31, 142–147 (2013) . - PMC - PubMed

Publication types