. 2016 Apr 7:6:24258.
doi: 10.1038/srep24258.

Alteration of podocyte phenotype in the urine of women with preeclampsia

Affiliations

Alteration of podocyte phenotype in the urine of women with preeclampsia

Tianyue Zhai et al. Sci Rep. .

Abstract

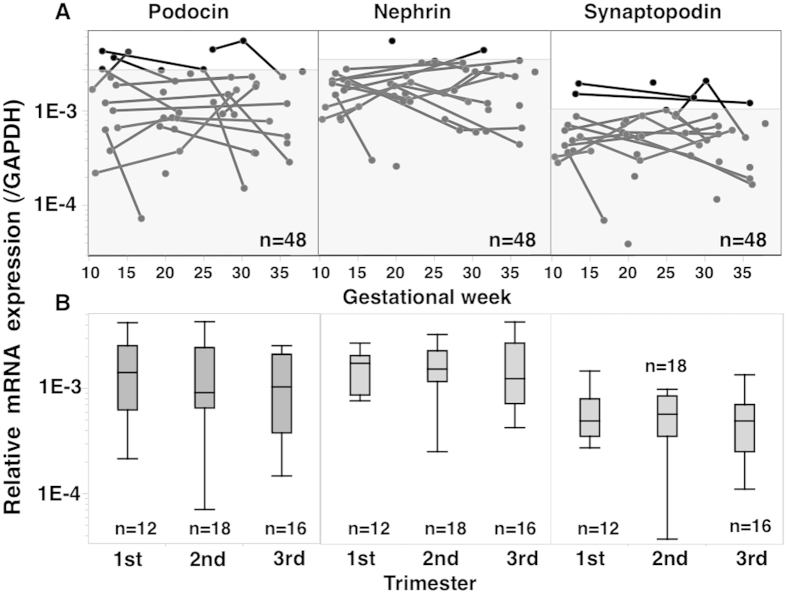
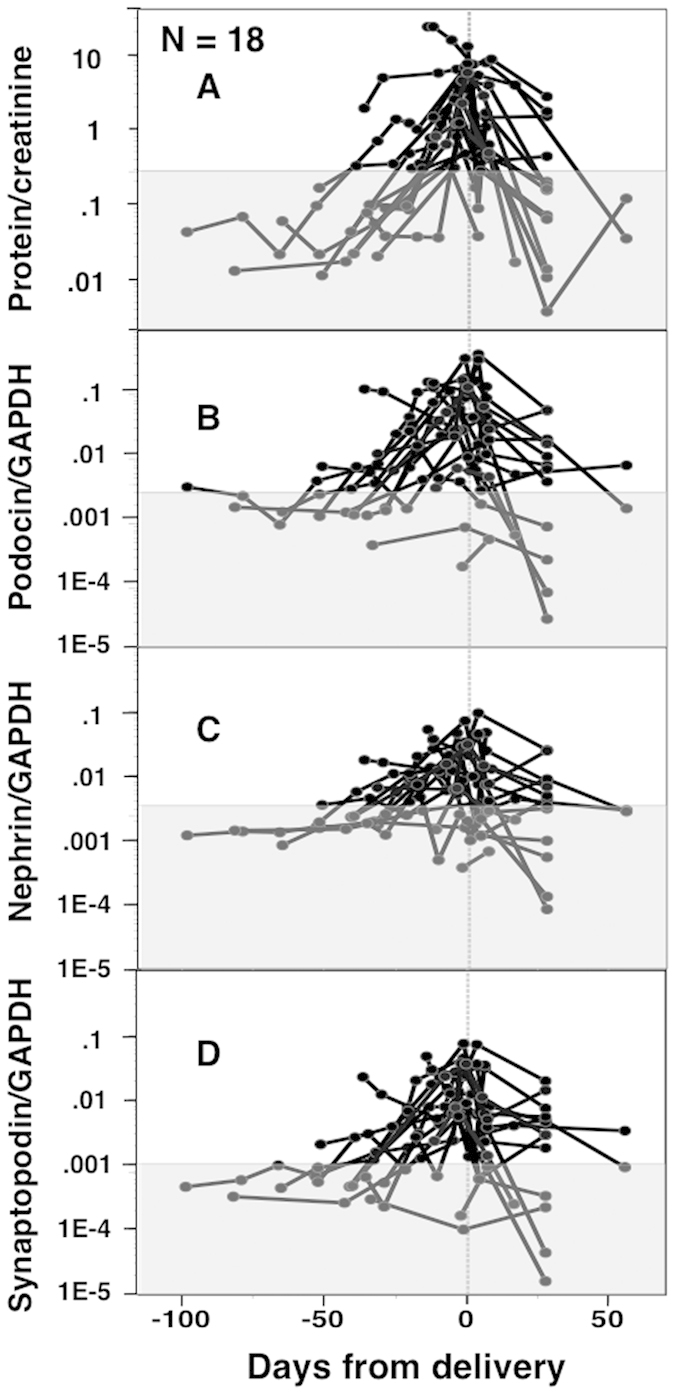
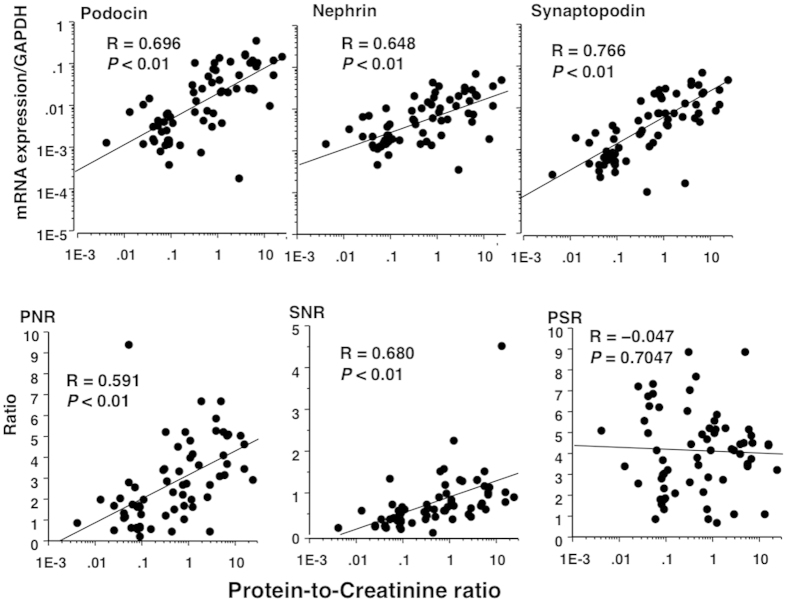
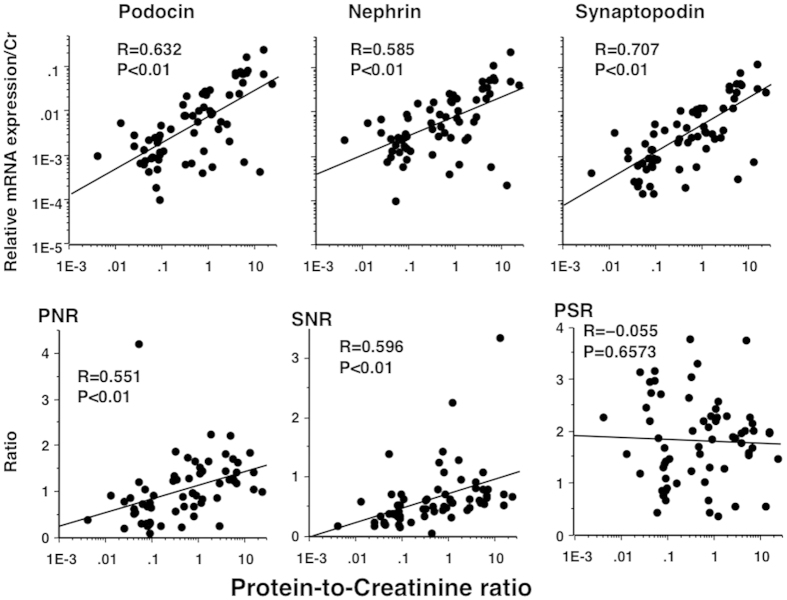
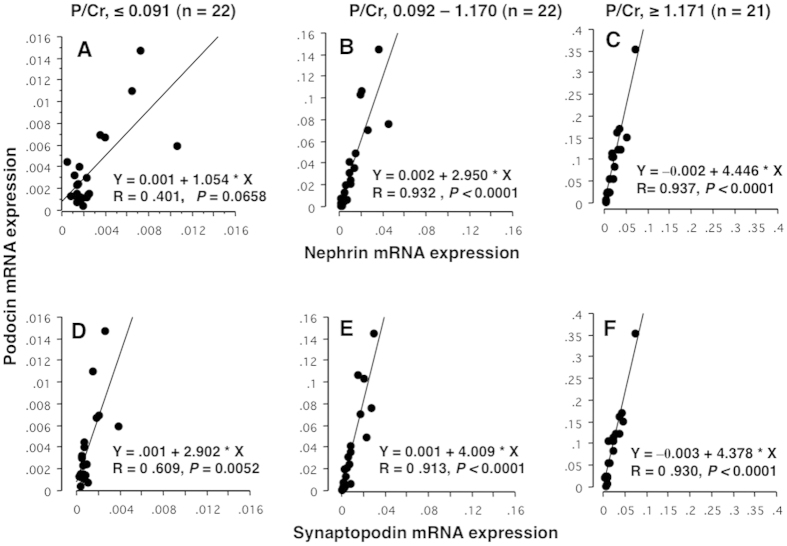
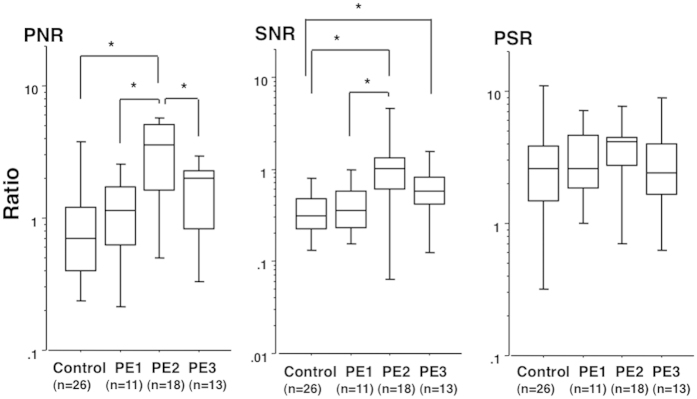
Podocyte injury has been suggested to induce phenotypic alteration of glomerular podocytes and accelerate the detachment of podocytes from the glomeruli resulting in podocyturia. However, it is not clear whether podocyte phenotypic alteration occurs in the urine of women with preeclampsia (PE). Seventy-seven and 116 pelleted urine samples from 38 and 18 women at various stages of normal and PE pregnancies, respectively underwent quantitative analysis of podocyte-specific or associated protein mRNA expression, including podocin, nephrin, and synaptopodin using RT-PCR. Significant proteinuria in pregnancy (SPIP) is defined as protein:creatinine ratio (P/Cr, mg/mg) ≥ 0.27 in the urine supernatant. All three urine-pellet mRNAs expression levels were significantly positively correlated with P/Cr levels, suggesting that podocyturia increased with proteinuria. The podocin:nephrin mRNA ratio (PNR) and synaptopodin:nephrin mRNA ratio (SNR) increased significantly with increasing P/Cr, while the podocin:synaptopodin mRNA ratio (PSR) did not change significantly according to P/Cr, resulting in significantly higher PNR and SNR, but not PSR levels, in urine from PE women with than without SPIP. The PNR, SNR, and PSR in urine from PE women before onset of SPIP were comparable to those from controls. Thus, nephrin mRNA expression was reduced in the podocytes recovered from PE women.


Conflict of interest statement

The authors declare no competing financial interests.

Figures

Figure 1
Figure 1. Changes in Pod-, Nep-, and Syn-mRNA expression levels in normtensive control pregnancies.
In this analysis, only urine specimens showing detectable levels of all three mRNAs were used (n = 48). However, the 90th percentile mRNA level was obtained using all 77 urine specimens from 38 normotensive control women on the assumption that in 29 specimens with at least one undetectable mRNA, all three mRNA expression levels were less than in 48 specimens with detectable levels of all three mRNAs. The shaded area in A indicates mRNA level <90th percentile. (B) Changes in mRNA expression according to pregnancy trimester. Only one datum with the highest value was used for women with multiple urine samples available within the same pregnancy trimester. No significant changes in mRNA expression occurred during pregnancy in control women.
Figure 2
Figure 2. Perinatal changes in P/Cr level and mRNA expression in 18 PE women.
In this analysis, only urine specimens showing detectable levels of all three mRNAs were used (n = 104). The shaded area indicates P/Cr <0.27 for (A) and <90th percentile mRNA level determined in Fig. 1 for (BD). Most PE women exhibited a gradual antenatal increase and postnatal decrease in P/Cr as well as the three mRNA expression levels.
Figure 3
Figure 3. Association of P/Cr levels with three mRNA expression levels, PNR, SNR, and PSR in antenatal urine samples from PE women.
In this analysis, only urine specimens showing detectable levels of all three mRNAs were used. In 65 antenatal urine samples from PE women, the relative expression levels of all three mRNAs (Pod-mRNA, Nep-mRNA, and Syn-mRNA) corrected by GAPDH were significantly positively correlated with P/Cr levels (upper panels). The PNR and SNR were also increased significantly with increasing P/Cr (lower panels). However, PSR did not change significantly according to P/Cr.
Figure 4
Figure 4. Association of P/Cr levels with three mRNA expression levels (corrected by urinary creatinine), PNR, SNR, and PSR in antenatal urine samples from PE women.
Urine specimens were the same as those in Fig. 3. The relative expression levels of all three mRNAs were quantified using a standard curve method and corrected by creatinine weight (mg) contained in the whole sample. All correlations (indicated by R values) were somewhat weaker in this analysis than in the analysis for Fig. 3.
Figure 5
Figure 5. Association of Pod-mRNA expression with those of Nep- and Syn-mRNA in tertile groups by P/Cr level.
Urine specimens were the same as those in Figs 3 and 4. Sixty-five antenatal urine samples from PE women were divided into tertile groups according to P/Cr (A,D, 1st tertile group with P/Cr level ≤0.091; B,E, 2nd tertile group with P/Cr level 0.092–1.170; and C and F, 3rd tertile group with P/Cr level ≥1.171). (AC) Correlations of Pod-mRNA against Nep-mRNA; (DF, correlations of Pod-mRNA against Syn-mRNA. The changes in slope of linear regression equation according to P/Cr levels were of interest: 1.054, 2.950, and 4.446 for correlations between Pod-mRNA and Nep-mRNA of the 1st, 2nd, and 3rd P/Cr tertile groups, respectively, and 2.902, 4.009, and 4.378 for correlations between Pod-mRNA and Syn-mRNA of the 1st, 2nd, and 3rd P/Cr tertile groups, respectively. The degree of increase in correlation coefficient according to P/Cr was more marked for Pod-mRNA against Nep-mRNA than against Syn-mRNA. The correlation was very strong (R value >0.9) even between Pod-mRNA and Syn-mRNA for the 2nd and 3rd P/Cr tertile groups, suggesting that Syn-mRNA also derived from podocytes.
Figure 6
Figure 6. PNR, SNR, and PSR in control women and PE women in various stages of pregnancy.
Urine samples from PE women were divided into three groups according to stage of PE pregnancy: PE1, antenatal but before SPIP onset; PE2, antenatal but after SPIP onset; and PE3, 1 month postpartum (collected on postpartum day 25–35). In this analysis, only urine specimens expressing detectable levels of all three mRNAs were used. Numbers in parentheses indicate the same number of urine specimens to number of individuals. Urine with the highest P/Cr level was used when multiple urine specimens meeting the designated condition were available for the same individual. The P/Cr levels were 0.06 (0.00–0.16), 0.07 (0.03–0.16), 3.82 (0.33–15.6), and 0.15 (0.01–2.14) for 26 control urine samples, 11 PE1 urine samples, 18 PE2 urine samples, and 13 PE3 urine samples, respectively. *P < 0.05 between two groups.

References

    1. Mundel P. & Shankland S. J. Podocyte biology and response to injury. J. Am. Soc. Nephrol. 13, 3005–3015 (2002). - PubMed
    1. Petermann A. T. et al.. Podocytes that detach in experimental membranous nephropathy are viable. Kidney Inter. 64, 1222–1231 (2003). - PubMed
    1. Vogelmann S. U., Nelson W. J., Myers B. D. & Lemley K. V. Urinary excretion of viable podocytes in health and renal disease. Am. J. Physiol. Renal Physiol. 285, F40–F48 (2003). - PMC - PubMed
    1. Garovic V. D. et al.. Urinary podocyte excretion as a marker for preeclampsia. Am. J. Obstet. Gynecol. 196, 320.e1–320.e7 (2007). - PubMed
    1. Konieczny A. et al.. Podocytes in urine, a novel biomarker of preeclampsia? Adv. Clin. Exp. Med. 22, 145–149 (2013). - PubMed

Publication types

MeSH terms

LinkOut - more resources