. 2016 Apr 5;15(1):117-131.
doi: 10.1016/j.celrep.2016.03.005. Epub 2016 Mar 24.

PRRT2 Is a Key Component of the Ca(2+)-Dependent Neurotransmitter Release Machinery

Affiliations

PRRT2 Is a Key Component of the Ca(2+)-Dependent Neurotransmitter Release Machinery

Pierluigi Valente et al. Cell Rep. .

Abstract

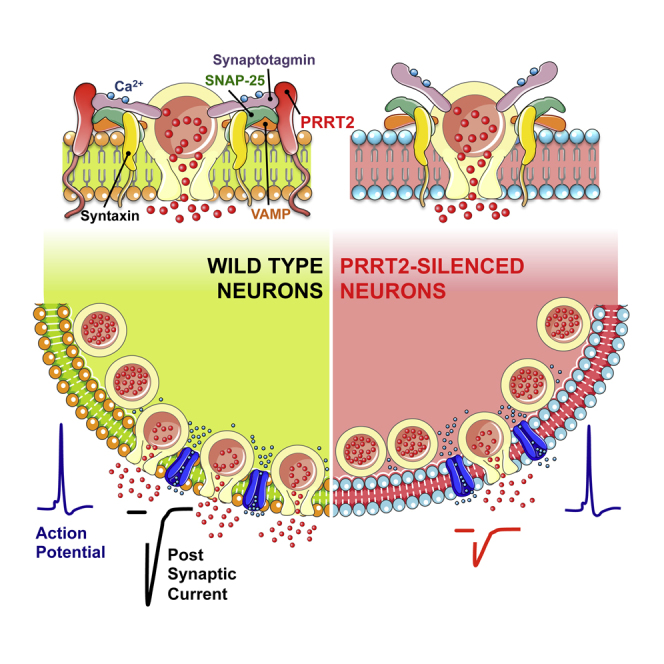
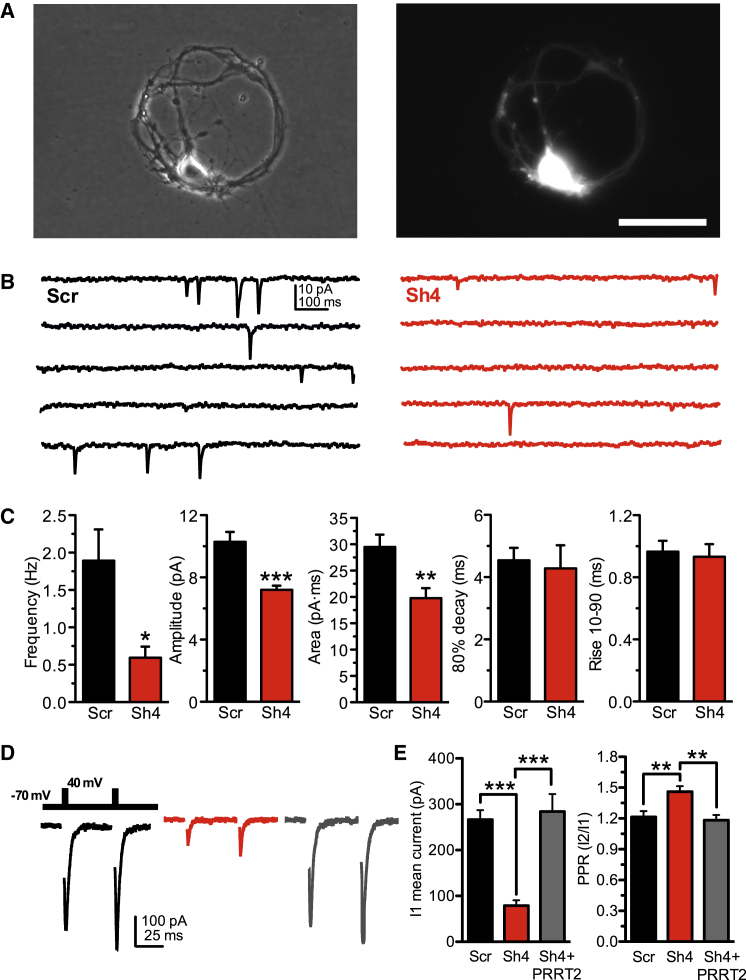
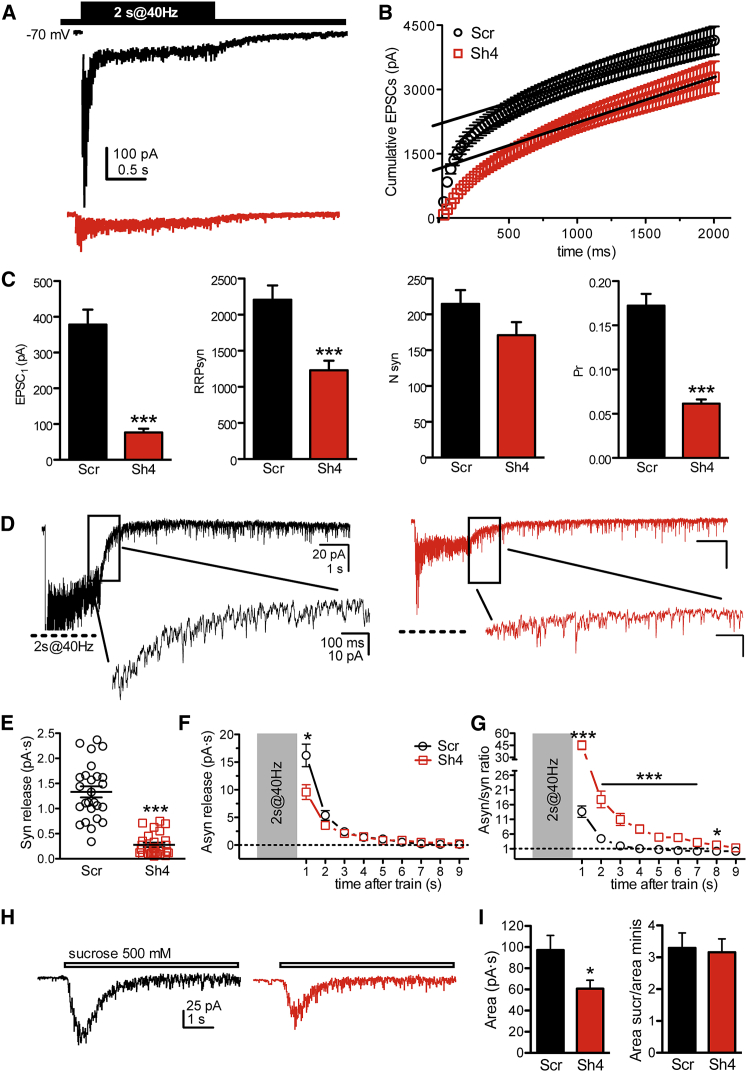
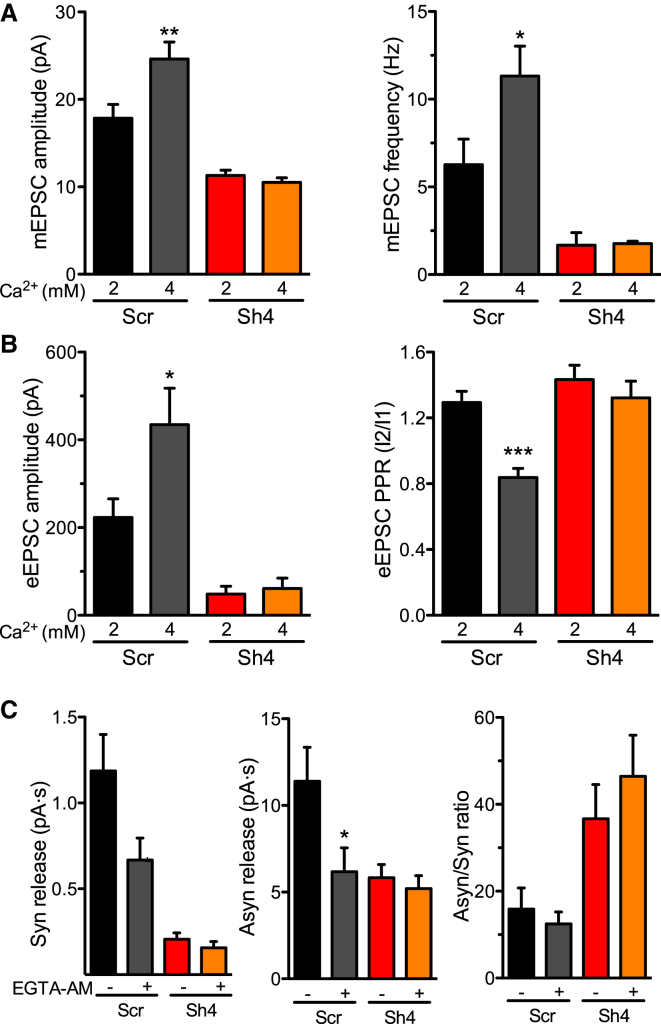
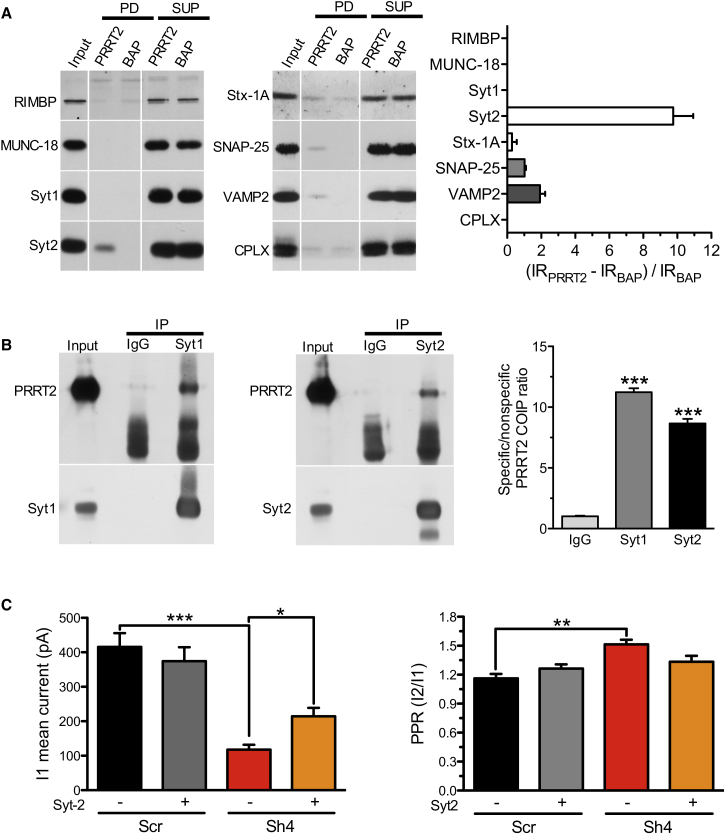
Heterozygous mutations in proline-rich transmembrane protein 2 (PRRT2) underlie a group of paroxysmal disorders, including epilepsy, kinesigenic dyskinesia, and migraine. Most of the mutations lead to impaired PRRT2 expression, suggesting that loss of PRRT2 function may contribute to pathogenesis. We show that PRRT2 is enriched in presynaptic terminals and that its silencing decreases the number of synapses and increases the number of docked synaptic vesicles at rest. PRRT2-silenced neurons exhibit a severe impairment of synchronous release, attributable to a sharp decrease in release probability and Ca(2+) sensitivity and associated with a marked increase of the asynchronous/synchronous release ratio. PRRT2 interacts with the synaptic proteins SNAP-25 and synaptotagmin 1/2. The results indicate that PRRT2 is intimately connected with the Ca(2+)-sensing machinery and that it plays an important role in the final steps of neurotransmitter release.

Keywords: PRRT2; knockdown; release probability; synaptic transmission; synaptotagmin; synchronous and asynchronous release.


Figures

None
Graphical abstract
Figure 1
Figure 1
PRRT2 Is Localized at the Presynaptic Level (A) Ultrafractionation of brain synaptosomes. Purified synaptosomes from adult mouse brain were subjected to ultrasynaptic fractionation to separate the AZ, PSD, and NSSP made by extrinsic and integral membrane proteins of the nerve terminal. Aliquots of total synaptosomes and of each ultrasynaptic fraction (10–30 μg) were probed with antibodies against PRRT2, SNAP-25, and protein markers to validate ultrasynaptic compartments such as synaptophysin-1 (Syp1) and PSD95 (top). Immunoblots were quantified by densitometric analysis of the fluorograms, and the values are expressed in mean (± SEM) percentages of the total amount (bottom). The partition of PSD95, Syp1, and SNAP-25 in the corresponding fractions is shown. Note that PRRT2 preferentially partitioned in the NSSP fraction, similarly to Syp1 and SNAP-25. (B) Subcellular distribution of endogenous PRRT2 in neurons. Forebrain fractions obtained at various stages of SV purification were analyzed by western blotting using antibodies to PRRT2, SNAP-25, and Syp1 (top). H, homogenate; S1, post-nuclear supernatant; S2, supernatant of P2; P2, crude synaptosomes; LP1, crude synaptic plasma membranes; LS1, supernatant of LP1; LP2, crude synaptic vesicles; LS2, synaptosol; USV, highly purified synaptic vesicles; SSV, salt-treated highly purified synaptic vesicles; FT, flowthrough fraction containing small presynaptic membranes. Immunoblots were quantified as in (A), and the value of each subcellular fraction is expressed in percentage of homogenate as means ± SEM (bottom). (C) Localization of PRRT2 in mature neurons. Primary hippocampal neurons transduced at 10 DIVs with PRRT2-mCherry (red) were subjected to immunostaining at 15 DIVs with antibodies to PRRT2, SNAP-25, and Syp1. PRRT2 immunoreactivity (red) largely overlapped with the staining of the two presynaptic proteins in axonal and nerve terminal areas. Scale bar, 10 μm. See also Figure S1.
Figure 2
Figure 2
PRRT2 Knockdown Decreases Synapse Density and Increases Docked SVs in Low-Density Hippocampal Neurons (A) Representative images of dendrites of hippocampal neurons infected at 7 DIVs with Scr, Sh4, and Sh4 + Sh4-resistant PRRT2 (Sh4+PRRT2) or left uninfected and analyzed at 14 DIVs. Synaptic boutons were identified by double immunostaining for Bassoon (Bsn, red) and Homer1 (green). The colocalization panels (Col. points) highlight the double-positive puncta (black) corresponding to synapses. Scale bar, 10 μm. (B) Quantitative analysis of synaptic puncta counted on 30-μm dendrite tracts starting from the cell body in neurons treated as in (A). Data are means ± SEM from three independent experiments, each carried out in duplicate. Five dendrites for each neuron, from at least ten neurons for each sample, were counted. p < 0.05, one-way ANOVA/Bonferroni’s multiple comparison test. NI, not infected. (C). Conventional TEM analysis of nerve terminals from PRRT2 KD hippocampal neurons revealed an increase in docked SVs and a preservation of the total SVs with respect to control neurons. Shown are representative TEM images of nerve terminals from neurons transduced with either Scr or Sh4 at 7 DIVs and fixed/processed at 14 DIVs. Scale bar, 200 μm. (D) Quantitative TEM analysis of the synaptic density from serial ultrathin sections. The volume density of symmetric and asymmetric synapses was calculated from the 2D count of synaptic profiles in sections from Sh4- (red bars) and Scr-treated (black bars) neurons and is expressed as mean (± SEM) number of synapses per square micrometer. (E). 3D reconstructions of synaptic terminals from serial ultrathin sections confirm the increase in the number of docked SVs in low-density neuronal cultures. Shown are representative 3D reconstructions from 60-nm-thick serial sections obtained from Scr-treated (left) and PRRT2 KD (right) synapses. Total SVs and SVs physically docked at the AZ are depicted as blue and red spheres, respectively. The AZ and mitochondria are shown in yellow and green, respectively. Scale bar, 200 nm. (F and G) Morphometric analysis of three-dimensionally reconstructed synapses. PRRT2 KD synapses (red bars) displayed an increased number of AZ-docked SVs (F) and a preserved total number of SVs (G) with respect to Scr-treated synapses (black bars). (H) Spatial distribution of SVs in nerve terminals of Scr-treated (black symbols) and Sh4-treated (red symbols) neurons. The mean (± SEM) number of SVs located within successive 50-nm shells from the AZ and normalized by the total SV content of each terminal is given as mean ± SEM as a function of the distance from the AZ. (I) Morphometric analysis of SV diameter. PRRT2 KD synapses (red bars) displayed a smaller SV size with respect to Scr-treated synapses (black bars). Nerve terminal areas (0.689 ± 0.044 μm2 and 0.741 ± 0.035 μm2 for Scr- and PRRT2 sh-RNA-infected neurons, respectively) and AZ lengths (0.302 ± 0.023 μm and 0.347 ± 0.013 μm for Scr- and PRRT2 sh-RNA-infected neurons, respectively) were similar in the two experimental groups (140 and 150 synapses for Scr and PRRT2 shRNA-infected neurons, respectively, from three independent preparations). p < 0.05, ∗∗p < 0.01, ∗∗∗p < 0.001, unpaired Student’s t test (E, G, and H) and Kolmogorov-Smirnov test (F). See also Figure S2.
Figure 3
Figure 3
PRRT2 Knockdown Slows Down SV Cycling in Response to Sustained High-Frequency Stimulation without Altering Exocytosis (A). Representative experimental field showing low-density hippocampal neurons co-expressing the reporter of SV exo-endocytosis synaptophysin-pHluorin (Syphy) and either Sh4 or Scr (mCherry). The merged images show the colocalization of the two markers at synaptic puncta. Scale bar, 10 μm. (B). Ensemble averaged traces of SypHy fluorescence from PRRT2 KD synapses (Sh4, red trace) and control synapses (Scr, black trace) recorded in response to electrical field stimulations at 20 Hz for 20 s (shaded area) in the absence or presence of bafilomycin (1 μM). Data are normalized to the maximum fluorescence intensity reached under NH4Cl perfusion (normalized ΔF). (C) Left: quantitative evaluation of the SV pool released during the stimulation and plotted as peak fluorescence reached at the end of the stimulation in the absence (left) or presence (right) of bafilomycin (Baf). Center: quantitative evaluation of the kinetics of SV endocytosis (τ decay phase) by single exponential fitting of the post-stimulus curves for Sh4-treated (red) and Scr-treated (black) synapses. Right: kinetics of SV release under stimulation at 20 Hz (left) and relative time constant (τ) of the rising phase in the absence or presence of bafilomycin determined by exponential fitting of individual experiments. The rate of SV release was greatly reduced in PRRT2 KD synapses (Sh4, red trace) compared with control synapses (Scr, black trace), but the rate of pure exocytosis determined by blocking reacidification with bafilomycin was not significantly altered by PRRT2 KD. Data are expressed as mean ± SEM (shown every five time points in B) from 11 (Sh4, 340 synapses) and 13 (Scr, 380 synapses) experiments from three different preparations. ∗∗p < 0.01 versus Scr; °°p < 0.01 versus Sh4+Baf; one-way ANOVA/Bonferroni’s or Kruskal-Wallis/Dunn’s tests. (D and E) Evaluation of the readily releasable pool in PRRT2-silenced neurons. (D) Ensemble-averaged SypHy traces from PRRT2 KD synapses (Sh4, red trace) and control synapses (Scr, black trace) recorded in response to electrical field stimulations with 40 APs at 20 Hz (shaded area) in the absence or presence of bafilomycin. Fluorescence values were normalized to the maximum fluorescence intensity reached under NH4Cl perfusion (normalized ΔF). (E) Left: peak fluorescence at the end of the stimulus recorded in the absence or presence of bafilomycin. Right: time constant of endocytosis (τ decay phase) evaluated by fitting the fluorescence decay after stimulation by a single exponential function for Sh4-treated (red) and Scr-treated (black) synapses. Data are expressed as mean ± SEM (shown every five time points in D) from nine (Sh4, 260 synapses) and ten (Scr, 240 synapses) experiments from three different preparations. See also Figure S3.
Figure 4
Figure 4
PRRT2 Knockdown Dramatically Decreases Spontaneous and Evoked Synaptic Transmission in Hippocampal Autaptic Neurons (A) Phase-contrast micrographs of a typical hippocampal autaptic neuron (left). The positivity of the same cell to infection with the Sh4 construct was probed by fluorescence imaging of the tGFP reporter (right). Scale bar, 100 μm. (B) Representative recording traces of mEPSCs from PRRT2-KD synapses (Sh4, red traces) and control synapses (Scr, black trace). (C) Analysis of mEPSCs. From left to right, shown are mean ± SEM frequency, amplitude, charge, 80% decay time, and 10%–90% rise time of mEPSCs calculated for PRRT2 KD (n = 11, red bars) and control (n = 15, black bars) neurons. All values were obtained from 100–1000 events recorded from each cell in 5-min recordings. (D) Representative eEPSCs recorded in excitatory autaptic neurons infected with Scr (black trace/bar, n = 39), PRRT2-Sh4 (red trace/bar, n = 32), or PRRT2-Sh4 + Sh-resistant PRRT2 (gray trace/bar, n = 21). eEPSCs were elicited by clamping the cell under study at –70 mV and stimulating it with two voltage steps to +40 mV lasting 0.5 ms at an inter-stimulus interval of 50 ms. The paired-pulse stimulation was applied every 10 s (inset). (E) Decrease of eEPSC amplitude and increase of PPR by PRRT2 KD and rescue of the PRRT2 KD phenotype by expression of Sh-resistant PRRT2. Shown is the quantitative analysis of the eEPSC amplitude evoked by the first pulse (I1, left) and PPR (I2/I1, right) recorded in excitatory autaptic neurons treated as described in (D). A complete rescue of the EPSC amplitude and PPR was observed in silenced neurons expressing Sh-resistant PRRT2. In all graphed currents, stimulation artifacts were blanked for clarity. Data are expressed as means ± SEM from the indicated numbers of cells recorded from at least three independent cell culture preparations. p < 0.05, ∗∗p < 0.01, ∗∗∗p < 0.001, unpaired Student’s t test or Mann-Whitney’s U test (C); Kruskal-Wallis/Dunn’s multiple comparison test (E). See also Figures S4 and S5.
Figure 5
Figure 5
PRRT2 Knockdown Strongly Decreases Synchronous but Not Asynchronous Release in Excitatory Autapses (A) Representative recordings of eEPSCs evoked by high-frequency stimulation (train of 80 stimuli at 40 Hz, inset) in autaptic hippocampal neurons infected with Scr (black trace) or PRRT2-Sh4 (red trace). Stimulation artifacts were blanked for clarity. (B) Profiles of the mean cumulative amplitude of eEPSCs for neurons infected with Scr (black trace, n = 38) or PRRT2-Sh4 (red trace, n = 34) constructs. Data points in the 1- to 2-s range were fitted by a linear regression and back-extrapolated to time 0 (solid lines) to estimate the RRPsyn. (C) Results of the quantal analysis. From left to right, shown are the mean ± SEM amplitude of the first eEPSC, RRPsyn size, number of RRPsyn quanta, and initial probability of release (Pr) estimated in neurons infected with Scr (n = 38, black bars) or PRRT2-Sh4 (n = 34, red bars). (D) Representative traces showing asynchronous release evoked by a tetanic stimulation of 2 s at 40 Hz in autaptic neurons transduced with either Scr (black traces) or PRRT2-Sh4 (red traces). Traces in the insets are shown in an expanded timescale. (E–G) Comparative analysis of synchronous and asynchronous release. (E) Individual values and mean (± SEM) of the synchronous charge released from Scr-infected (black, n = 26) and Sh4-infected (red, n = 26) neurons stimulated by one AP 10 s before the train. Synchronous charge was estimated by measuring the area of the eEPSC in a time window of 5 ms following its activation. (F) Time course of asynchronous release calculated by measuring the area of the spontaneous EPSCs evoked by tetanic stimulation. The area was calculated in nine time windows, each lasting 1 s. (G) Time course of the synchronous/asynchronous ratio calculated for the nine time windows from the data shown in (C) and (B), respectively. (H and I) Estimation of RRPtotal by hypertonic stimulation of autaptic neurons. (H) Representative EPSC responses activated by 6 s of hypertonic stimulation (horizontal bar) recorded in autaptic neurons transduced with either scrambled shRNA (black) or PRRT2-Sh4 (red). (I) Mean values (± SEM) of the RRPtotal charge transfer obtained by hypertonic stimulation and number of RRPtotal quanta obtained in either Scr (black, n = 18) or PRRT2-Sh4 (red, n = 15) neurons by dividing the RRPtotal charge by the unitary mEPSC charge. Data are shown as means ± SEM. p < 0.05, ∗∗p < 0.01, ∗∗∗p < 0.001, unpaired Student’s t test or Mann-Whitney U test.
Figure 6
Figure 6
The Ca2+ Sensitivity of Spontaneous and Synchronous Release Is Decreased by PRRT2 Knockdown (A) Amplitude (left) and frequency (right) of mEPSCs recorded in neurons transduced with Scr (black/gray bars, n = 9/7) and Sh4 (red/orange bars, n = 10/8) as a function of the extracellular Ca2+ concentration (2 mM Ca2+, black/red bars; 4 mM Ca2+, gray/orange bars). (B) eEPSC amplitude evoked by the first pulse (I1, left) and PPR (I2/I1, right) recorded in neurons transduced with Scr (black/gray bars, n = 7) or PRRT2-Sh4 (red/orange bars, n = 6). The graph bars represent the mean of the EPSC amplitude and PPR recorded in individual cells before (black/red bars) and after (gray/orange bars) the increase of the extracellular Ca2+ concentration to 4 mM. (C) Effects of EGTA-AM on synchronous and asynchronous release. Left: synchronous charge released from Scr-treated (black/gray bars, n = 12) and Sh4-treated (red/orange bars, n = 11) neurons stimulated by one AP 10 s before the train. Synchronous charge was estimated by measuring the area of the eEPSC in a time window of 5 ms following its activation. Center: asynchronous charge induced by a tetanic stimulation of 2 s at 40 Hz and calculated by measuring the area of the spontaneous EPSCs in the time window of 1 s after the end of the train. Right: synchronous/asynchronous ratio calculated for the nine time windows from the data shown in (C) and (B), respectively. Data are means ± SEM. p < 0.05, ∗∗p < 0.01, ∗∗∗p < 0.001, one-way ANOVA/Bonferroni’s multiple comparison test. See also Figure S6.
Figure 7
Figure 7
PRRT2 Interacts with the SNARE Complex Proteins and the Fast Ca2+ Sensors Synaptotagmin 1 and 2 (A) Pull-down assays with FLAG-tagged PRRT2. Left: FLAG-tagged PRRT2 (PRRT2) and bacterial alkaline phosphatase (BAP) vectors were expressed in HEK293T cells, purified by anti-FLAG M2 affinity gel, and incubated with synaptosome lysates. After pull-down (PD), pellets were solubilized and subjected to a western blotting assay together with aliquots of the starting material (input) and of the supernatants (SUP) using antibodies for a variety of potential presynaptic interactors of PRRT2, as shown. Vertical white lines in the blot indicate that the lanes were on the same gel but have been repositioned in the figure. Synaptosomal lysates incubated with FLAG-PRRT2 showed specific immunoreactivity for the SNARE complex proteins SNAP-25 and VAMP2 and for Syt2, which was not detected in FLAG-BAP precipitates. RIMBP, Rim binding protein; Syt, synaptotagmin; Stx-1A, syntaxin-1A, CPLX, complexins 1/2. Right: Immunoblots were quantified by densitometric analysis of the fluorograms obtained in the linear range of the emulsion response. The percent increase in the specific pull-down of the immunoreactivity (IR) by FLAG-PRRT2 with respect to the non-specific IR pulled down by the FLAG-BAP control ((IRPRRT2 – IRBAP) / IRBAP) was calculated and is shown for each potential interactor as mean ± SEM (n = 3–4 independent PRRT2 preparations and subcellular fractionations). (B) Co-immunoprecipitation of PRRT2 with Syt1 and Syt2. Detergent extracts of mouse brain were immunoprecipitated (IP) with monoclonal antibodies (mAbs) specific for Syt1 and Syt2 or with the respective control mouse immunoglobulin Gs (IgGs) as indicated. After electrophoretic separation of the immunocomplexes and western blotting, membranes were probed with anti-Syt1/anti-Syt2 antibodies to test the efficiency of the immunoprecipitation as well as with polyclonal anti-PRRT2 antibodies. Left: a representative immunoblot is shown. Right: quantification of the PRRT2 immunoreactive signal in the immunoprecipitated samples, normalized to the binding to the mouse IgG control (means ± SEM, n = 3 independent experiments). Input, 10 μg total extract. (C) Overexpression of Syt2 partially rescues the impairment in synchronous release of PRRT2 KD neurons. Autaptic hippocampal neurons were infected at 7 DIVs with Scr (n = 31), Sh4/mCherry (Sh4, n = 30), Syt2/GFP (Syt2, n = 28), or Sh4+Syt2 (n = 27) and recorded at 14 DIVs. The histograms show the means ± SEM of the eEPSC amplitude evoked by the first pulse (I1, left) and of the PPR (I2/I1, right). p < 0.05, ∗∗p < 0.01; ∗∗∗p < 0.001; Kruskal-Wallis/Dunn’s multiple comparison test (I1); one-way ANOVA/Bonferroni’s multiple comparison test (PPR). See also Figure S7.

Comment in

References

    1. Chen W.J., Lin Y., Xiong Z.Q., Wei W., Ni W., Tan G.H., Guo S.L., He J., Chen Y.F., Zhang Q.J. Exome sequencing identifies truncating mutations in PRRT2 that cause paroxysmal kinesigenic dyskinesia. Nat. Genet. 2011;43:1252–1255. - PubMed
    1. Chiappalone M., Casagrande S., Tedesco M., Valtorta F., Baldelli P., Martinoia S., Benfenati F. Opposite changes in glutamatergic and GABAergic transmission underlie the diffuse hyperexcitability of synapsin I-deficient cortical networks. Cereb. Cortex. 2009;19:1422–1439. - PubMed
    1. Ebrahimi-Fakhari D., Saffari A., Westenberger A., Klein C. The evolving spectrum of PRRT2-associated paroxysmal diseases. Brain. 2015;138:3476–3495. - PubMed
    1. Fioravante D., Regehr W.G. Short-term forms of presynaptic plasticity. Curr. Opin. Neurobiol. 2011;21:269–274. - PMC - PubMed
    1. Fox M.A., Sanes J.R. Synaptotagmin I and II are present in distinct subsets of central synapses. J. Comp. Neurol. 2007;503:280–296. - PubMed

Publication types