. 2016 May 24;133(21):2050-65.
doi: 10.1161/CIRCULATIONAHA.115.021019. Epub 2016 Apr 6.

Smooth Muscle Enriched Long Noncoding RNA (SMILR) Regulates Cell Proliferation

Affiliations

Smooth Muscle Enriched Long Noncoding RNA (SMILR) Regulates Cell Proliferation

Margaret D Ballantyne et al. Circulation. .

Abstract

Background: Phenotypic switching of vascular smooth muscle cells from a contractile to a synthetic state is implicated in diverse vascular pathologies, including atherogenesis, plaque stabilization, and neointimal hyperplasia. However, very little is known about the role of long noncoding RNA (lncRNA) during this process. Here, we investigated a role for lncRNAs in vascular smooth muscle cell biology and pathology.

Methods and results: Using RNA sequencing, we identified >300 lncRNAs whose expression was altered in human saphenous vein vascular smooth muscle cells following stimulation with interleukin-1α and platelet-derived growth factor. We focused on a novel lncRNA (Ensembl: RP11-94A24.1), which we termed smooth muscle-induced lncRNA enhances replication (SMILR). Following stimulation, SMILR expression was increased in both the nucleus and cytoplasm, and was detected in conditioned media. Furthermore, knockdown of SMILR markedly reduced cell proliferation. Mechanistically, we noted that expression of genes proximal to SMILR was also altered by interleukin-1α/platelet-derived growth factor treatment, and HAS2 expression was reduced by SMILR knockdown. In human samples, we observed increased expression of SMILR in unstable atherosclerotic plaques and detected increased levels in plasma from patients with high plasma C-reactive protein.

Conclusions: These results identify SMILR as a driver of vascular smooth muscle cell proliferation and suggest that modulation of SMILR may be a novel therapeutic strategy to reduce vascular pathologies.

Keywords: RNA, untranslated; atherosclerosis; cell proliferation; microRNAs; plasma protein, human.


Figures

Figure 1.
Figure 1.
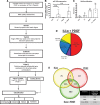
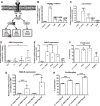
RNA sequencing shows IL1α and PDGF induction of inflammatory and cell cycle pathways. A, Study design for determination of the transcriptome in quiescent and stimulated HSVSMCs. HSVSMCs were treated for 72 hours, RNA quality was assessed and subjected to RNA-seq following the Tuxedo pipeline for analysis. B, Known inflammatory microRNA, miR146a, is upregulated by IL1α (n=4). **P<0.01 vs 0.2% condition. Multiple comparison 1-way ANOVA. C, BrdU incorporation as an indirect marker of proliferation was assessed in all patients (n=3). **P<0.01 vs 0.2% condition. D, Biotype distribution of all transcripts identified by RNA-seq analysis generated from HSVSMCs treated with IL1α and PDGF, cutoff at FPKM>0.1 E, Venn diagram indicating overlap of protein-coding genes with altered expression (analyzed using EdgeR, FDR<0.01) across each treatment. ANOVA indicates analysis of variance; BrdU, bromodeoxyuridine; FC, fold change; FDR, false discovery rate; FPKM, fragments per kilobase of exon per million fragments mapped; HSVSMC, human saphenous vein–derived smooth muscle cell; IL1α, interleukin-1α; lncRNA, long noncoding RNA; miR, microRNA; miscRNA, miscellaneous RNA; miRNA, microRNA; PDGF, platelet-derived growth factor; and UBC, ubiquitin C.
Figure 2.
Figure 2.
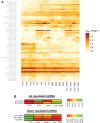
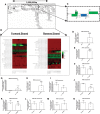
Identification of differentially expressed lncRNAs in HSVSMCs treated with IL1α and PDGF. A, Heatmaps showing order of differentially expressed transcripts within the 4 patient samples before and after IL1α/PDGF treatment. lncRNA selected for validation marked by *. B, Heatmap representing the fold change of the 5 lncRNAs selected for validation. Heatmaps represent data from RNA-seq pipeline. HSVSMC indicates human saphenous vein–derived smooth muscle cell; IL1α, interleukin-1α; lncRNA, long noncoding RNA; and PDGF, platelet-derived growth factor.
Figure 3.
Figure 3.
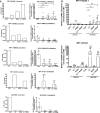
Treatment with IL1α and PDGF significantly altered lncRNA expression and showed distinct expression within vascular cell types. A, Graphs indicate fold change of lncRNA from RNA-seq data and subsequent validation by qRT-PCR (n=4). *P<0.05, **P<0.01, ***P<0.001 vs 0.2% condition. B, Basal and stimulated expression of lncRNAs 2 and 7 within HSVEC and HSVSMC (n=4 for SMC and n=3 for EC; *P<0.05, **P<0.01, ***P<0.001 vs 0.2% in each specific cell type). EC indicates endothelial cell; HSVEC, human saphenous vein–derived endothelial cell; HSVSMC, human saphenous vein–derived smooth muscle cell; IL1α, interleukin-1α; lncRNA, long noncoding RNA; PDGF, platelet-derived growth factor; qRT-PCR, quantitative real-time polymerase chain reaction; SMC, smooth muscle cell; and UBC, ubiquitin U.
Figure 4.
Figure 4.
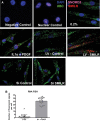
Localization of SMILR. A, RNA FISH analysis of SMILR, cytoplasmic UBC mRNA, and nuclear SNORD3 RNA in HSVSMC. Magnification ×630 for all panels. UBC and SNORD3 used for confirmation of cellular compartments. B, Quantification of lncRNA molecules per cell in indicated conditions. More than 5 images were selected at random from each condition, and at least 4 cells were counted in each image. DAPI indicates 4,6-diamidino-2-phenylindole-2-HCl; FISH, fluorescent in situ hybridization; HSVSMC, human saphenous vein–derived smooth muscle cell; IL1α, interleukin-1α; lncRNA, long noncoding RNA; LV, lentivirus; PDGF, platelet-derived growth factor; si, small interfering; UBC, ubiquitin U.
Figure 5.
Figure 5.
Functional regulation of SMILR. A, Schematic diagram showing specific sites of inhibition. HSVSMCs were pretreated for 60 minutes with the indicated concentration of the inhibitors. Following exposure to vehicle or 10 ng/mL IL1 or 20 nmol/L PDGF for 24 hours, expression of SMILR was determined by qRT-PCR. B, SMILR expression following MEKK1 inhibition. ***P<0.01 vs 0.2% media, ### P<0.001 vs IL1/PDGF treatment. Repeated-measures ANOVA (n=3). C, SMILR expression following p38 inhibition. Repeated-measures ANOVA. ***P<0.01 vs 0.2% media, ### P<0.001 vs IL1/PDGF treatment alone (n=3). D, SMILR expression in conditioned media from HSVSMCs cultured in 0.2%, IL1 or PDGF conditions. Unpaired t test. *P<0.05 vs 0.2% (n=4). E, Confirmation of the effect of siRNA targeting SMILR in HSVSMCs by using qRT-PCR (n=3). One-way ANOVA ***P<0.001 vs 0.2% control. ### P<0.001 vs IL1 + PDGF treatment. F, IL1/PDGF induced proliferation classed as 100% for analysis across patient samples, knockdown of SMILR inhibits EdU incorporation in HSVSMCs (n=3) One-way ANOVA vs Si control. ## P<0.01. G, qRT-PCR analysis of SMILR expression following infection with either an empty lentivirus (LV-E) or lentivirus containing SMILR sequence (LV-S) at an MOI of 25 (n=3) and MOI 50 (n=3) ***P<0.001 vs relevant empty control assessed via multiple-comparison ANOVA. ANOVA indicates analysis of variance; EdU, 5-ethynyl-2′-deoxyuridine; HSVSMC, human saphenous vein–derived smooth muscle cell; IL1α, interleukin-1α; lncRNA, long noncoding RNA; MAPK, mitogen-activated protein kinase; MOI, multiplicity of infection; ns, not significant; PDGF, platelet-derived growth factor; qRT-PCR, quantitative real-time polymerase chain reaction; Si, small interfering; siRNA, small interfering RNA; and UBC, ubiquitin.
Figure 6.
Figure 6.
SMILR regulates proximal gene HAS2 in chromosome 8. A, Schematic view of the 8q24.1 region showing lncRNAs and protein-coding genes over the 5 000 000-bp region from Ensemble. B, Regulation of protein-coding and noncoding genes within the selected region following IL1α and PDGF treatment; heatmap depicts expression of genes found with RNA-seq in 4 patient samples. C, Dotted line marks region containing SMILR lincRNA and closest protein-coding genes HAS2 and ZHX2. D, Expression of proximal gene HAS2 – modulated in the same manner as SMILR with IL1α and PDGF treatment (n=3). Unpaired t test: ***P<0.001 vs 0.2%. E and F, Additional HAS isoforms are differentially modulated by IL1 and PDGF (n=3). Unpaired t test: ***P<0.001 vs 0.2%. G through I, Validation of RNA-seq data for lncRNAs SMILR and HAS2-AS1 by qRT-PCR (n=3). *P<0.05 and **P<0.01 vs 0.2%, unpaired t test. J, Inhibition of SMILR expression via dsiRNA treatment significantly inhibits HAS2 expression determined by qRT-PCR **P<0.01 vs Si control. Unpaired t test (n=3). K through N, SMILR inhibition had no effect on proximal genes ZHX2 or HAS2-AS1 nor additional HAS isoforms, HAS1 or HAS3 (n=3). Unpaired t test. ANOVA indicates analysis of variance; dsiRNA, dicer substrate small interfering RNA; HSVSMC, human saphenous vein–derived smooth muscle cell; IL1α, interleukin-1α; lincRNA, intervening long noncoding RNA; lncRNA, long noncoding RNA; PDGF, platelet-derived growth factor; qRT-PCR, quantitative real-time polymerase chain reaction; Si, small interfering; and UBC, ubiquitin.
Figure 7.
Figure 7.
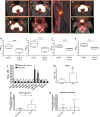
Uptake of [18F]fluoride and [18F]FDG within plaque and normal artery and changes in noncoding RNA expression within carotid plaques. Axial images demonstrating unilateral (A, B) or bilateral [18F]fluoride carotid uptake (D, E). C is a multiplanar reformat of B. Axial images demonstrating [18F]FDG carotid uptake (F, G). H shows the Siemens Biograph Clinical PET/CT system used for imaging. White arrows indicate carotid radioligand uptake. H through K, L, Uptake of tracer: MicroRNA profile of atherosclerotic plaque and paired healthy carotid controls (n=6) assessed by qRT-PCR (paired Student t test). Expression of SMILR (M), HAS2 (N), and HAS2-AS1(O) within atherosclerotic plaque (n=5). Analyzed via qRT-PCR analysis, ***P<0.001, **P<0.01, and *P<0.05 assessed by paired Student t test. CT, computed tomography; [18F]FDG, 18F-fluorodeoxyglucose; PET, positron emission tomography; and qRT-PCR, quantitative real-time polymerase chain reaction.
Figure 8.
Figure 8.
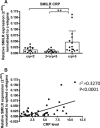
SMILR is detectable within plasma samples and correlates with patient CRP levels. A, SMILR expression is increased in patients with higher CRP levels (n=13 CRP<2; n=13 CRP2–5; and n=15 CRP>5; *P<0.05, **P<0.01 via 1-way ANOVA). B, Correlation between SMILR expression and CRP levels (linear regression P<0.0001). CRP indicates C-reactive protein; lncRNA, long noncoding RNA; and UBC, ubiquitin.

Similar articles

Cited by

References

    1. Marx SO, Totary-Jain H, Marks AR. Vascular smooth muscle cell proliferation in restenosis. Circ Cardiovasc Interv. 2011;4:104–111. doi: 10.1161/CIRCINTERVENTIONS.110.957332. - PMC - PubMed
    1. Ghouri N, Purves D, McConnachie A, Wilson J, Gill JM, Sattar N. Lower cardiorespiratory fitness contributes to increased insulin resistance and fasting glycaemia in middle-aged South Asian compared with European men living in the UK. Diabetologia. 2013;56:2238–2249. doi: 10.1007/s00125-013-2969-y. - PMC - PubMed
    1. Gomez D, Owens GK. Smooth muscle cell phenotypic switching in atherosclerosis. Cardiovasc Res. 2012;95:156–164. doi: 10.1093/cvr/cvs115. - PMC - PubMed
    1. Alexander MR, Owens GK. Epigenetic control of smooth muscle cell differentiation and phenotypic switching in vascular development and disease. Annu Rev Physiol. 2012;74:13–40. doi: 10.1146/annurev-physiol-012110-142315. - PubMed
    1. Schermuly RT, Dony E, Ghofrani HA, Pullamsetti S, Savai R, Roth M, Sydykov A, Lai YJ, Weissmann N, Seeger W, Grimminger F. Reversal of experimental pulmonary hypertension by PDGF inhibition. J Clin Invest. 2005;115:2811–2821. doi: 10.1172/JCI24838. - PMC - PubMed

Publication types

MeSH terms

Substances