. 2016 Apr 7:7:11231.
doi: 10.1038/ncomms11231.

4D Visualization of replication foci in mammalian cells corresponding to individual replicons

Affiliations

4D Visualization of replication foci in mammalian cells corresponding to individual replicons

V O Chagin et al. Nat Commun. .

Abstract

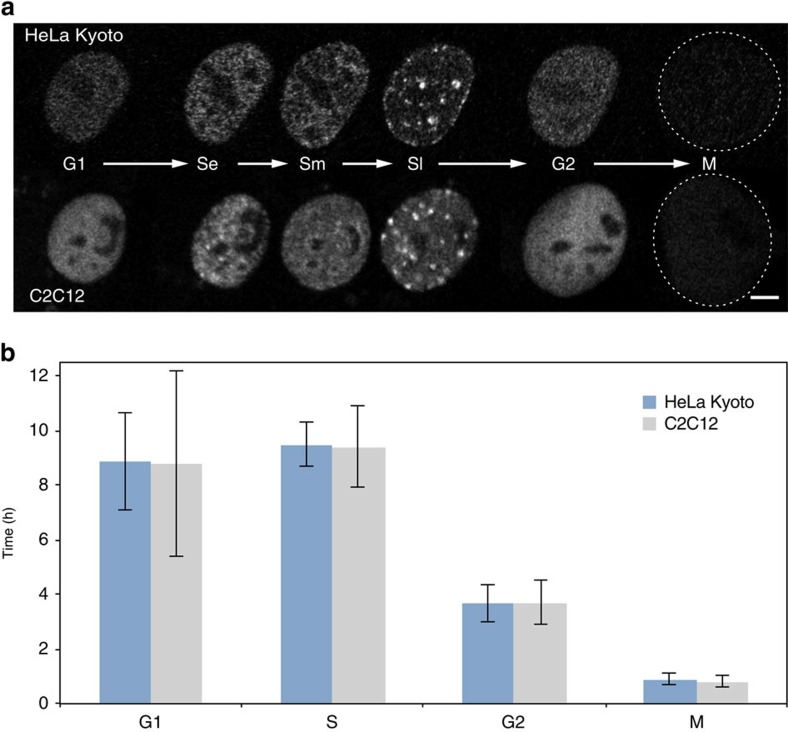
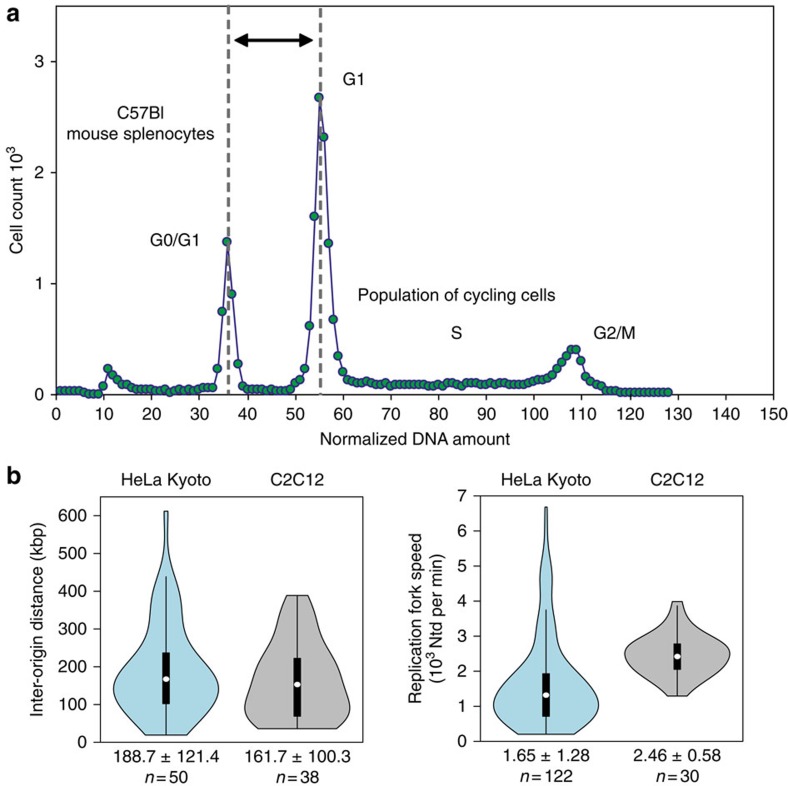
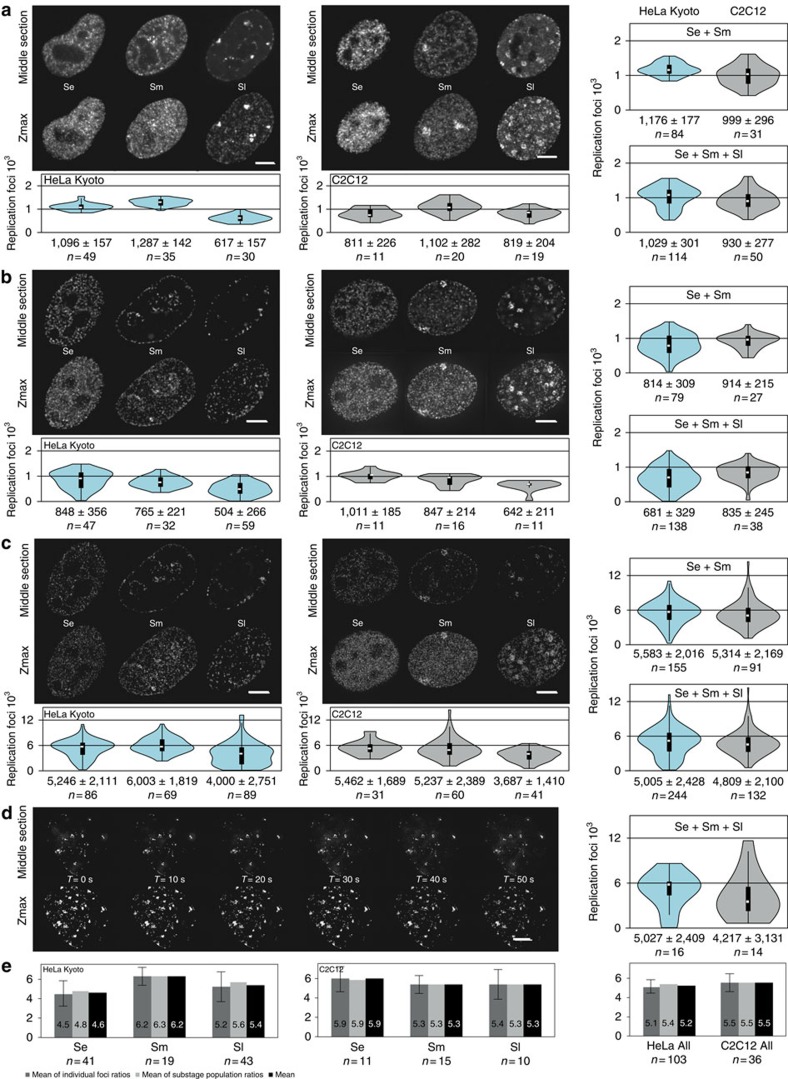
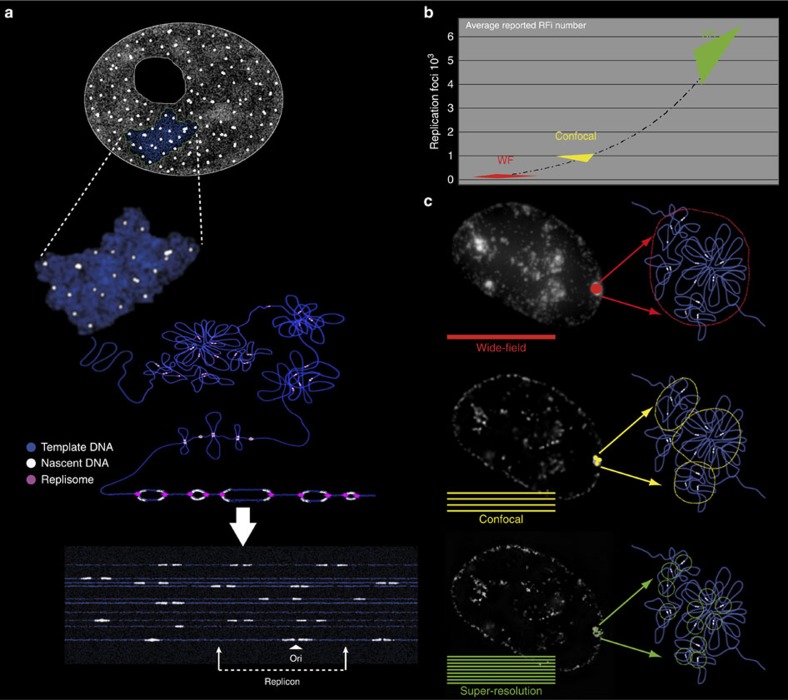
Since the pioneering proposal of the replicon model of DNA replication 50 years ago, the predicted replicons have not been identified and quantified at the cellular level. Here, we combine conventional and super-resolution microscopy of replication sites in live and fixed cells with computational image analysis. We complement these data with genome size measurements, comprehensive analysis of S-phase dynamics and quantification of replication fork speed and replicon size in human and mouse cells. These multidimensional analyses demonstrate that replication foci (RFi) in three-dimensional (3D) preserved somatic mammalian cells can be optically resolved down to single replicons throughout S-phase. This challenges the conventional interpretation of nuclear RFi as replication factories, that is, the complex entities that process multiple clustered replicons. Accordingly, 3D genome organization and duplication can be now followed within the chromatin context at the level of individual replicons.


Figures

Figure 1
Figure 1. Direct measurement of cell cycle kinetics.
(a) Patterns of PCNA distribution in all cell cycle stages imaged with live-cell time-lapse microscopy of human HeLa Kyoto (top) and mouse C2C12 cells (bottom). S-phase stages are further subdivided into early (Se) mid (Sm) and late (Sl). (b) Duration of the cell cycle phases (mean±s.d.; additional data in Table 1) measured from time-lapse microscopy analysis as shown in a (see also Supplementary Movie 1). Error bars represent s.d., number of replicates for human cells G1: 31, S: 30, G2: 27, M: 26; mouse cell replicates, G1: 20, S: 16, G2: 5, M: 10. Scale bar, 5 μm.
Figure 2
Figure 2. Genomic DNA content and DNA fibre analysis of replicons.
(a) DNA flow cytometry histogram of ethidium bromide/olivomycin stained HeLa Kyoto mCherry-PCNA expressing cells admixed with C57Bl mouse splenocytes is shown. The peak at channels 34–38 corresponds to the G1/G0 peak of non-cycling splenocytes. HeLa Kyoto cell cycle distribution is represented by a typical DNA flow cytometry histogram consisting of G1, S-phase and G2/M populations. To calculate the amount of genomic DNA in the cycling cell line, G1/G0 peak of mouse splenocytes and G1 peak of the cell line were approximated with Gaussian distributions and the relative position of the G1 peak was calculated (for details see methods and Table 2). (b) Cells were pulse labelled with IdU for 30 min, followed by a 30 min CldU pulse. Whole-genome DNA was extracted under gentle conditions and single DNA fibres were stretched with the constant factor of 2 kbp per μm. Incorporated nucleotides were immunostained and signals acquired in a wide-field microscope. Fluorescent tracks were measured by hand and used to calculate mean IOD and RFS. For details see methods; Supplementary Fig. 2 and Tables 3 and 4.
Figure 3
Figure 3. 3D quantification of RFi numbers throughout S-phase.
(a) Mid sections and maximum intensity z-projections (Zmax) of spinning disk confocal microscopy images of human (HeLa Kyoto) and mouse (C2C12) cells as indicated representative of the three major S-phase patterns—early (Se), mid (Sm) and late (Sl)—are shown. Scale bar, 5 μm. Numbers (mean±s.d.; summary of the data in Supplementary Fig. 5 and Supplementary Table 1) of nuclear RFi quantified as described in Supplementary Fig. 3 are plotted separately for each of the three major S-phase patterns as well as the pooled data for Se and Sm and the whole S-phase. N indicates the number of cells analysed. (b) As in a representative images from wide-field deconvolution microscopy and corresponding RFi numbers. Scale bar, 5 μm. (c) As in a representative images from 3D-SIM and corresponding RFi numbers. Scale bar, 5 μm. (d) Time series (see also Supplementary Movie 2) of live mouse cells imaged using 3D-SIM and corresponding RFi numbers for mouse and also for human cells. Scale bar, 5 μm. (e) Histogram of RFi ratios from super-resolution versus conventional microscopy. Ratios were calculated either per individual cell (dark grey) or from all cells pooled (light grey). In addition, both data sets were combined (black). Given error bars represent the s.d.
Figure 4
Figure 4. Replication sites dissected by super-resolution microscopy in the mammalian nucleus correspond to individual replicons.
(a) A cartoon showing how replication sites/units can be seen at different levels of chromatin compaction from the extended DNA fibres to the 3D-preserved whole-cell (nucleus) level. (b) Increase in RFi numbers driven by resolution improvements in microscopy during the past three decades. WF: wide field; SR: super-resolution microscopy. (c) Microscopic images and corresponding cartoon interpretation of replication sites in the mammalian nucleus imaged at different levels of resolution. For summary of experimental numbers and calculations see Table 5.

References

    1. Chagin V. O., Stear J. H. & Cardoso M. C. Organization of DNA replication. Cold Spring Harb. Perspect. Biol. 2, a000737 (2010). - PMC - PubMed
    1. Shermoen A. W., McCleland M. L. & O'Farrell P. H. Developmental control of late replication and S phase length. Curr. Biol. 20, 2067–2077 (2010). - PMC - PubMed
    1. Goldar A., Labit H., Marheineke K. & Hyrien O. A dynamic stochastic model for DNA replication initiation in early embryos. PloS ONE 3, e2919 (2008). - PMC - PubMed
    1. Rhind N. DNA replication timing: random thoughts about origin firing. Nat. Cell. Biol. 8, 1313–1316 (2006). - PMC - PubMed
    1. Cairns J. Autoradiography of HeLa cell DNA. J. Mol. Biol. 15, 372–373 (1966). - PubMed

Publication types

MeSH terms

Substances