

Review
doi: 10.1186/s13059-016-0927-y.
Design and computational analysis of single-cell RNA-sequencing experiments
Affiliations
- PMID: 27052890
- PMCID: PMC4823857
- DOI: 10.1186/s13059-016-0927-y
Item in Clipboard
Review
Design and computational analysis of single-cell RNA-sequencing experiments
Genome Biol.
.
Abstract
Single-cell RNA-sequencing (scRNA-seq) has emerged as a revolutionary tool that allows us to address scientific questions that eluded examination just a few years ago. With the advantages of scRNA-seq come computational challenges that are just beginning to be addressed. In this article, we highlight the computational methods available for the design and analysis of scRNA-seq experiments, their advantages and disadvantages in various settings, the open questions for which novel methods are needed, and expected future developments in this exciting area.
Figures
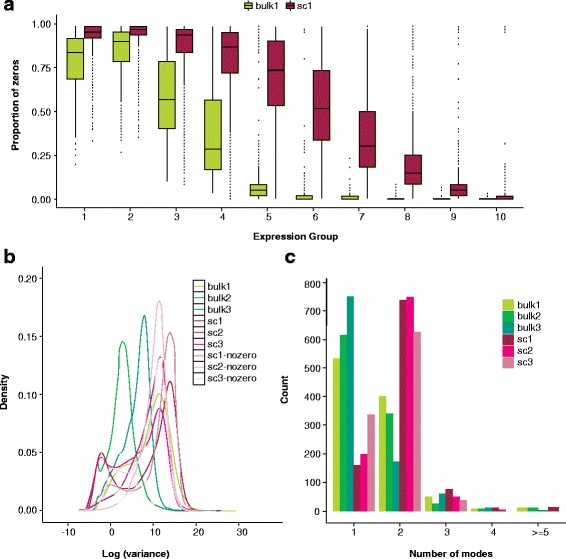
Prominent features in single-cell RNA-seq data relative to bulk RNA-seq include an abundance of zeros, increased variability, and multi-modal expression distributions. a Boxplots of the gene-specific proportion of zeros in a bulk (bulk1) and single-cell (sc1) dataset stratified by percentile of median gene expression. Sequencing depth ranges from 420,000 to 16.6 million in bulk1 and 385,000 to 16.4 million in sc1 (samples were chosen to have comparable depths; see the “Data” section). b Densities of gene-specific log variance for all genes in three bulk and three single-cell RNA-seq datasets. Densities are also shown for the single-cell datasets for log variances calculated following the removal of zeros, emphasizing that the increased variability observed relative to bulk is not entirely due to the presence of zeros. c For each dataset shown in b, 1000 genes were selected at random from the list of genes for which at least 75 % of cells showed non-zero expression. For each gene, zeros were removed and Mclust [92] was applied to log expression to estimate the number of modes. Because zeros were removed prior to Mclust, a mode at zero will not contribute to the total number of modes shown
References
-
- Hicks SC, Teng M, Irizarry RA. On the widespread and critical impact of systematic bias and batch effects in single-cell RNA-Seq data. bioRxiv. 2015. doi: http://dx.doi.org/10.1101/025528. - DOI
Publication types
MeSH terms
Grants and funding
LinkOut - more resources
Full Text Sources
Other Literature Sources
