. 2016 Apr 6;36(14):4000-9.
doi: 10.1523/JNEUROSCI.3967-15.2016.

Brain-Wide Maps of Synaptic Input to Cortical Interneurons

Affiliations

Brain-Wide Maps of Synaptic Input to Cortical Interneurons

Nicholas R Wall et al. J Neurosci. .

Abstract

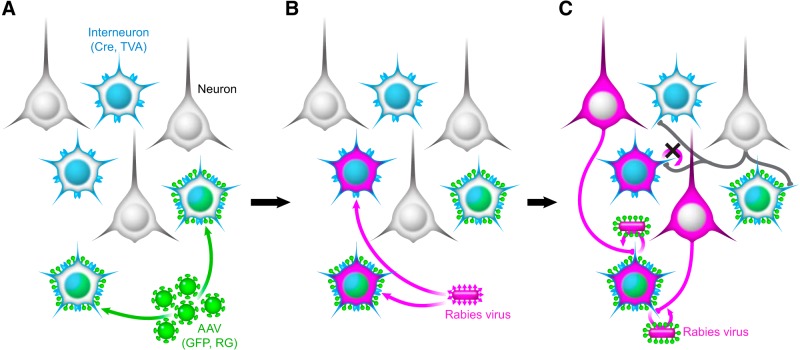
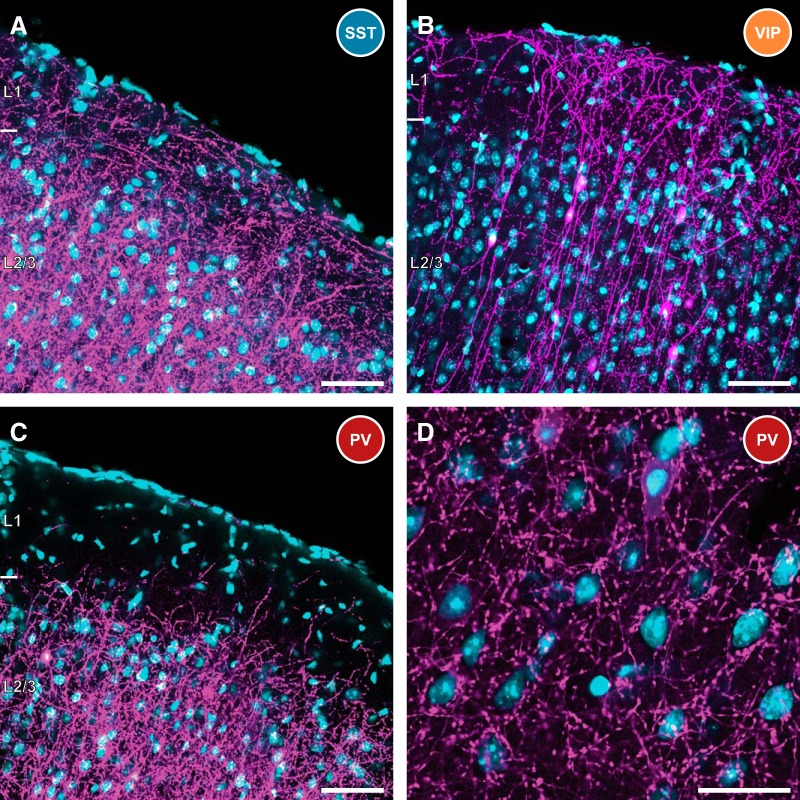
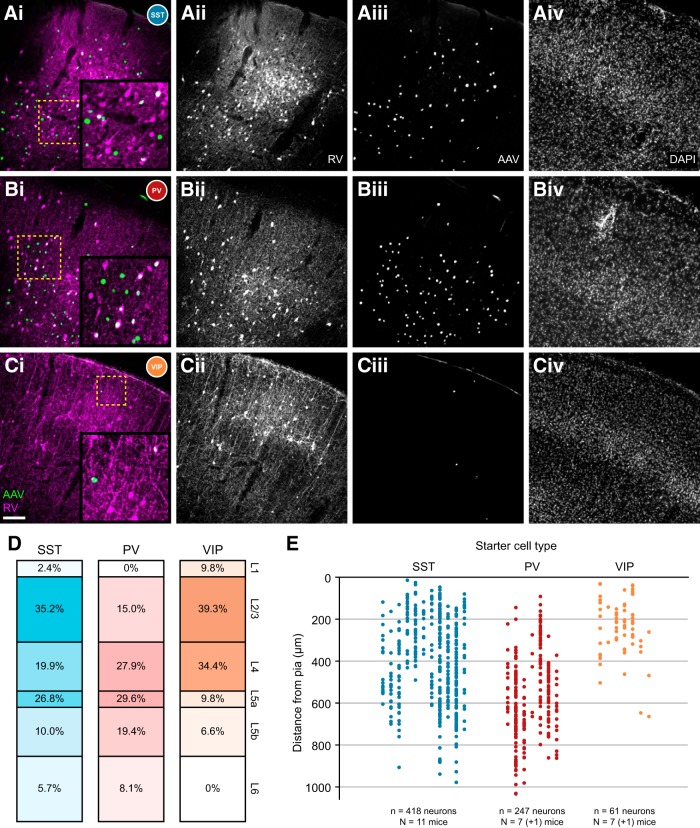
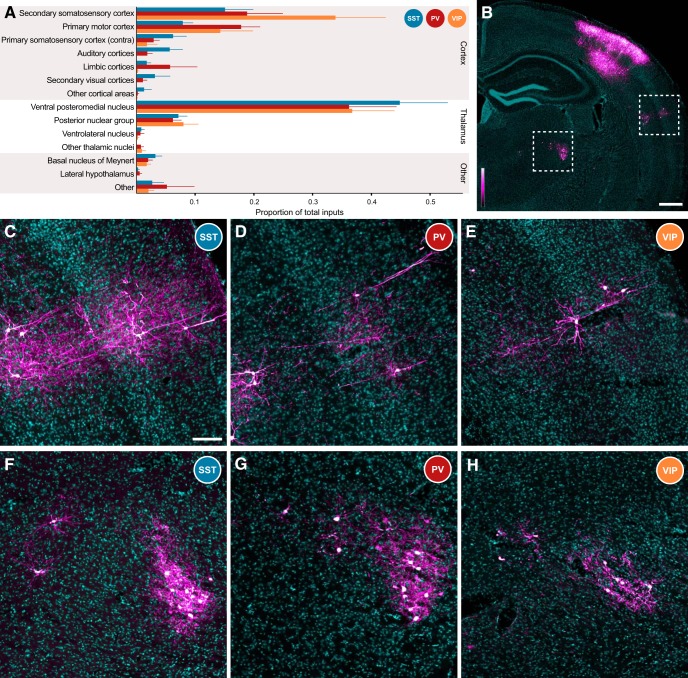
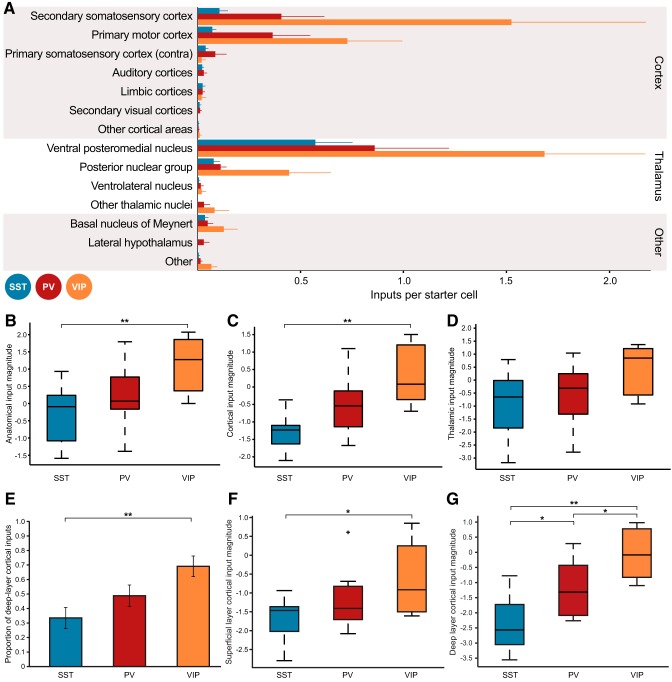
Cortical inhibition is mediated by diverse inhibitory neuron types that can each play distinct roles in information processing by virtue of differences in their input sources, intrinsic properties, and innervation targets. Previous studies in brain slices have demonstrated considerable cell-type specificity in laminar sources of local inputs. In contrast, little is known about possible differences in distant inputs to different cortical interneuron types. We used the monosynaptic rabies virus system, in conjunction with mice expressing Cre recombinase in either parvalbumin-positive, somatostatin-positive (SST+), or vasoactive intestinal peptide-positive (VIP+) neurons, to map the brain-wide input to the three major nonoverlapping classes of interneurons in mouse somatosensory cortex. We discovered that all three classes of interneurons received considerable input from known cortical and thalamic input sources, as well as from probable cholinergic cells in the basal nucleus of Meynert. Despite their common input sources, these classes differed in the proportion of long-distance cortical inputs originating from deep versus superficial layers. Similar to their laminar differences in local input, VIP+ neurons received inputs predominantly from deep layers while SST+ neurons received mostly superficial inputs. These classes also differed in the amount of input they received. Cortical and thalamic inputs were greatest onto VIP+ interneurons and smallest onto SST+ neurons.

Significance statement: These results indicate that all three major interneuron classes in the barrel cortex integrate both feedforward and feedback information from throughout the brain to modulate the activity of the local cortical circuit. However, differences in laminar sources and magnitude of distant cortical input suggest differential contributions from cortical areas. More input to vasoactive intestinal peptide-positive (VIP+) neurons than to somatostatin-positive (SST+) neurons suggests that disinhibition of the cortex via VIP+ cells, which inhibit SST+ cells, might be a general feature of long-distance corticocortical and thalamocortical circuits.

Keywords: S1; barrel cortex; cortex; inhibitory neuron.


Figures

Figure 1.
Figure 1.
Monosynaptic RV system labels the direct presynaptic inputs to interneurons infected with both AAV and RV. A, Elements of the monosynaptic RV system. Rosa26-LSL-TVA mice were crossed with either PV-Cre, SST-Cre, or VIP-Cre animals to produce mice expressing Cre and TVA (light blue) in a restricted subset of neurons. AAV8-DIO-HB (green), when injected into cortex, expresses nuclear-localized eGFP and RG only in Cre-expressing interneurons. B, EnvA+RVdG-mCh (magenta) is injected in the same location 3–4 weeks later. This virus can only infect cells expressing TVA. C, Only cells that express both TVA and RG permit retrograde spread of RV. Thus, only cells expressing both H2B-eGFP (coexpressed with RG) and mCherry are true starter cells. One week later, monosynaptic inputs to targeted interneurons are brightly labeled with mCherry.
Figure 2.
Figure 2.
Characteristics of infected interneurons in SST, VIP, and PV-Cre mice. A, SST-expressing interneurons are known to heavily innervate the distal dendrites of cortical pyramidal cells. This is evidenced by the high density of projections in superficial layers, including high axon density in layer 1. The distal dendrites of some retrogradely infected pyramidal cells are also visible extending into layer 1. RV, magenta; DAPI, cyan. This is consistent for all panels. Scale bar, 50 μm. B, Rabies-infected VIP-expressing interneurons are largely bipolar in nature, with a primary neurite extending into layer 1, and the other projecting to deeper layers of cortex. The cell bodies of these neurons are primarily found in superficial cortical layers. Scale bar, 50 μm. C, As expected from the properties of PV+ interneurons, very few projections are detected in layer 1 of PV-Cre mice following AAV and RV infection. However, there is heavy innervation of deeper cortical layers. Scale bar, 50 μm. D, Fluorescently labeled basket-type synapses are prevalent in PV-Cre mice, ringing neuronal somata in deeper layers of cortex. This is consistent with efficient targeting to PV-expressing basket cells in this mouse line. Scale bar, 25 μm.
Figure 3.
Figure 3.
Population description of targeted interneurons in the barrel cortex. Ai, Barrel cortex in SST-Cre mice. AAV-infected (green) and RV-infected (magenta) cells are numerous, and starter cells (white) are found throughout cortical layers. As expected, SST+ interneurons and fluorescent neurites are detectable in layer 1. Aii–Civ, Single fluorescence channels for RV (Aii), AAV (Aiii), and DAPI (Aiv) are also included. Bii–Biv, Cii–Civ, Single fluorescence channels are labeled as in Aii–Aiv. Scale bar: (in Ci), Ai–Civ, 100 μm. Ai, Bi, Ci, Higher-magnification insets are indicated by dashed yellow boxes. B, Barrel cortex in PV-Cre mice. As expected, starter cells can be found in layers 2–6 but are absent from layer 1. Neurite label is absent in layer 1, but basket-type bouton clusters are detectable in deeper layers, as expected. C, Barrel cortex in VIP-Cre mice. Relatively few starter cells are detected, but are most prevalent in superficial layers. As expected, interneuron morphology is largely bipolar in nature. D, Layer distribution of starter interneurons. Most SST+ starter cells were found in layers 2/3 and 5a, as expected from targeting a population enriched with Martinotti cells. PV+ starter cells were distributed throughout layers 2–6, but never in layer 1. VIP+ starter cells were largely contained in superficial cortical layers. E, Individual distribution of starter interneurons. Each column indicates one animal, and the y-axis indicates starter cell distance from pia. Each filled circle indicates a single starter cell.
Figure 4.
Figure 4.
Distribution of brain-wide inputs to cortical interneurons. A, Overall, proportional input to all three interneuron classes was similar. All three interneuron types received inputs from secondary somatosensory cortex (S2), primary motor cortex (M1), and contralateral primary somatosensory cortex (S1BF), the major sources of long-range corticocortical input to S1. All three classes also received similar proportions of input from the VPm and the Po, the primary and secondary thalamic nuclei known to project into S1. Other minor input streams, such as innervation from the basal nucleus of Meynert, were also detected. Thick bars depict mean proportion of inputs, and thin lines indicate +1 SEM. B, Low-magnification depiction of a brain slice from a PV-Cre mouse. S2 is indicated by the dashed box at the far right, and is depicted at higher magnification for all three mouse lines in C–E. A region of thalamus, including nuclei VPm and Po, is outlined by the dashed box to the left, and is explored at higher magnification in F–H. RV signal is depicted with a custom magenta-hot lookup table (see lookup table to bottom left), and DAPI is in cyan. This is consistent across all panels. Scale bar, 500 μm. C–E, S2 inputs to S1 interneurons are largely detected in deep layer 3, layer 5A, and along the border between layers 5B and 6. Although in the images depicted cortical inputs are most numerous in the SST-Cre line (C), the overall proportion of inputs is similar across the PV-Cre (D) and VIP-Cre (E) lines. Scale bar: (in C) C–H, 100 μm. F–H, Thalamic inputs to S1 interneurons are present in both Po (left) and VPm (right), with many more cells within the boundaries of VPm. Again, total inputs depicted to SST (F) interneurons are most numerous, but the overall proportion of inputs is consistent across the PV-Cre (G) and VIP-Cre (H) lines.
Figure 5.
Figure 5.
Number of input neurons per starter cell varies across cortical interneuron class. A, Plot of number of input neurons per starter cell for each of the brain regions described in Figure 4A. VIP+ interneurons tend to receive greater numbers of inputs per starter cell than other interneuron types; this is quantified in B–D. Thick bars depict mean numbers of inputs per starter cell, and the thin line indicates +1 SEM. B, Anatomical input magnitude distribution for each interneuron class. Input magnitude is defined as the natural log of the number of input neurons per starter cell, with a small modifier for division of small numbers (see main text). Colored boxes indicate the 25th–75th percentiles. The horizontal line contained in each colored box indicates the median input magnitude for that interneuron class. Whiskers indicate the full extent of the data. When summed across all brain areas, SST input is weaker than VIP input (p < 0.01), with PV input magnitude tending to fall between the other two interneuron types. C, Cortical input magnitude distribution is calculated as in B, but only for cortical inputs. Again, cortical input to SST cells is weaker than that to VIP interneurons (p < 0.01). D, Thalamic input magnitude distribution. Although there was a tendency toward a difference between the three groups (p = 0.07 by one-way ANOVA), variability across mice prevented any post hoc comparison. E, Proportion of deep layer (layer 5–6) input compared with total cortical input. VIP interneurons receive a greater proportion of deep-layer input than SST interneurons (p < 0.01). F, Superficial layer (layer 2–3) cortical input magnitude. Even though VIP+ interneurons received the smallest proportion of superficial layer inputs (Fig. 5E), VIP+ interneurons still received higher levels of superficial input per starter cell than SST+ interneurons (p < 0.05). A single outlier (>2.7σ) in the PV interneuron group is plotted as a black cross. G, Deep layer (layer 5–6) cortical input magnitude. As expected from C and E, VIP interneurons have the greatest deep-layer input strength, followed by PV interneurons, then finally the SST cell population (VIP vs PV, p < 0.05; VIP vs SST, p < 0.01; PV vs SST, p < 0.05).

References

    1. Adesnik H, Bruns W, Taniguchi H, Huang ZJ, Scanziani M. A neural circuit for spatial summation in visual cortex. Nature. 2012;490:226–231. doi: 10.1038/nature11526. - DOI - PMC - PubMed
    1. Callaway EM, Luo L. Monosynaptic circuit tracing with glycoprotein-deleted rabies viruses. J Neurosci. 2015;35:8979–8985. doi: 10.1523/JNEUROSCI.0409-15.2015. - DOI - PMC - PubMed
    1. Caputi A, Rozov A, Blatow M, Monyer H. Two calretinin-positive GABAergic cell types in layer 2/3 of the mouse neocortex provide different forms of inhibition. Cereb Cortex. 2009;19:1345–1359. doi: 10.1093/cercor/bhn175. - DOI - PubMed
    1. Dantzker JL, Callaway EM. Laminar sources of synaptic input to cortical inhibitory interneurons and pyramidal neurons. Nat Neurosci. 2000;3:701–707. doi: 10.1038/76656. - DOI - PubMed
    1. DeFelipe J, Jones EG. High-resolution light and electron microscopic immunocytochemistry of colocalized GABA and calbindin D-28k in somata and double bouquet cell axons of monkey somatosensory cortex. Eur J Neurosci. 1992;4:46–60. doi: 10.1111/j.1460-9568.1992.tb00108.x. - DOI - PubMed

Publication types

MeSH terms

LinkOut - more resources