. 2016 Apr 6;36(14):4010-25.
doi: 10.1523/JNEUROSCI.4352-15.2016.

Counting Vesicular Release Events Reveals Binomial Release Statistics at Single Glutamatergic Synapses

Affiliations

Counting Vesicular Release Events Reveals Binomial Release Statistics at Single Glutamatergic Synapses

Gerardo Malagon et al. J Neurosci. .

Abstract

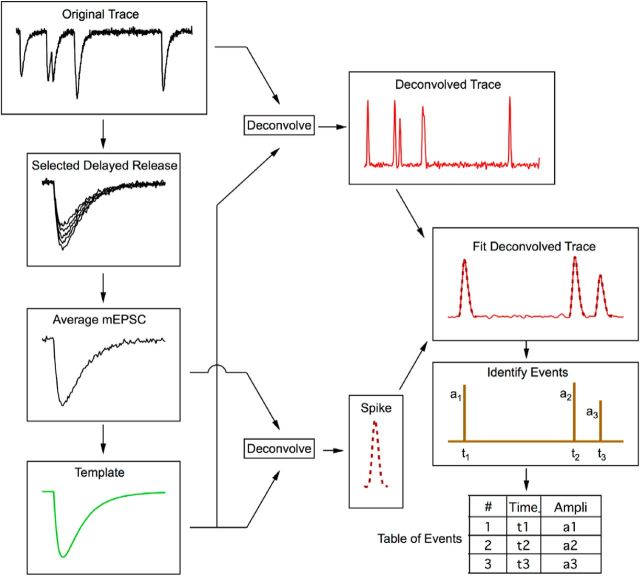
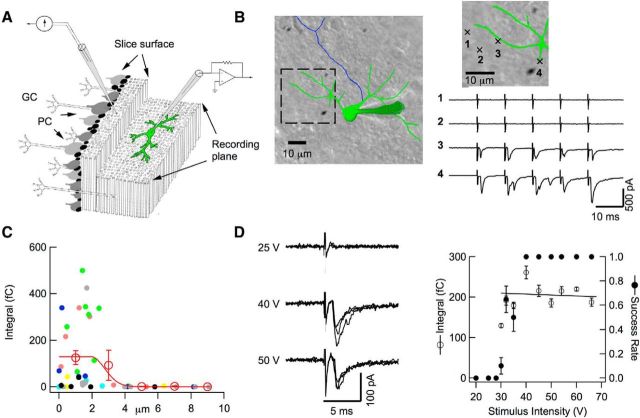
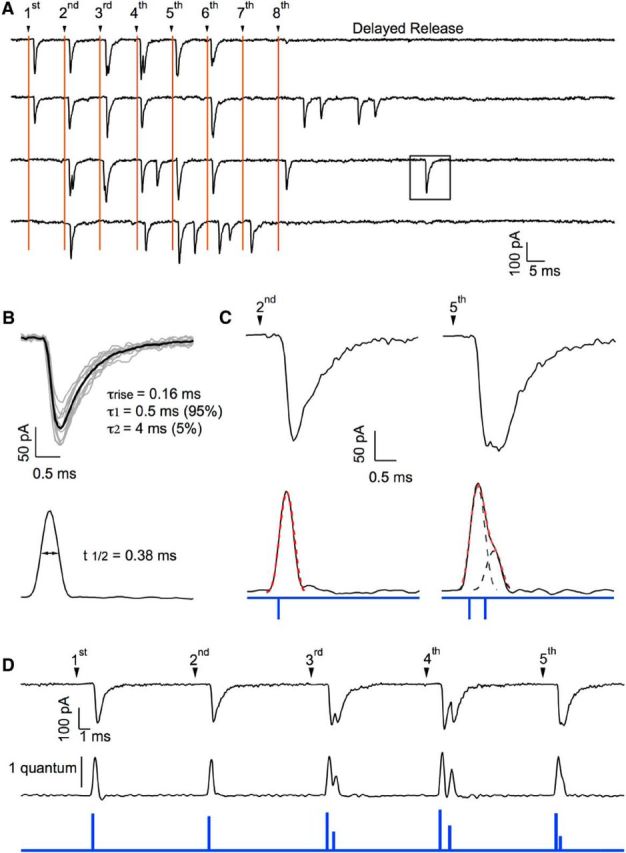
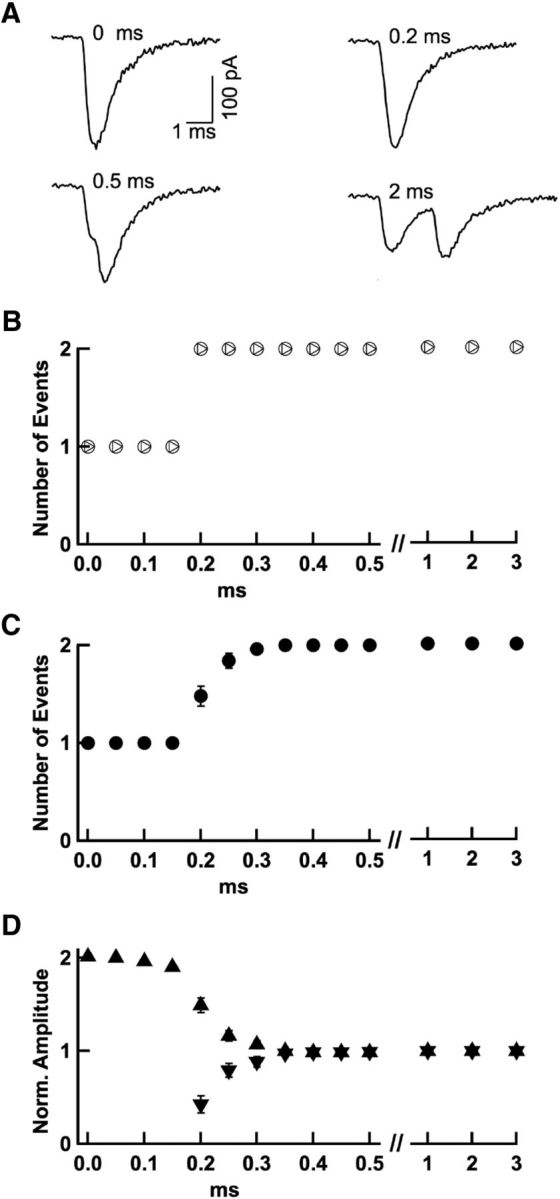
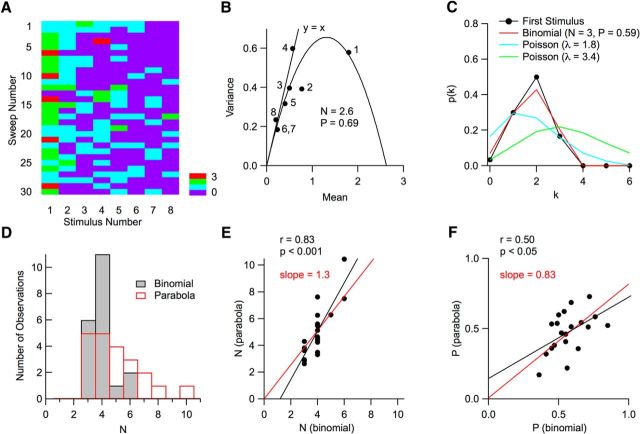
Many central glutamatergic synapses contain a single presynaptic active zone and a single postsynaptic density. However, the basic functional properties of such "simple synapses" remain unclear. One important step toward understanding simple synapse function is to analyze the number of synaptic vesicles released in such structures per action potential, but this goal has remained elusive until now. Here, we describe procedures that allow reliable vesicular release counting at simple synapses between parallel fibers and molecular layer interneurons of rat cerebellar slices. Our analysis involves local extracellular stimulation of single parallel fibers and deconvolution of resulting EPSCs using quantal signals as template. We observed a reduction of quantal amplitudes (amplitude occlusion) in pairs of consecutive EPSCs due to receptor saturation. This effect is larger (62%) than previously reported and primarily reflects receptor activation rather than desensitization. In addition to activation-driven amplitude occlusion, each EPSC reduces amplitudes of subsequent events by an estimated 3% due to cumulative desensitization. Vesicular release counts at simple synapses follow binomial statistics with a maximum that varies from 2 to 10 among experiments. This maximum presumably reflects the number of docking sites at a given synapse. These results show striking similarities, as well as significant quantitative differences, with respect to previous results at simple GABAergic synapses.

Significance statement: It is generally accepted that the output signal of individual central synapses saturates at high release probability, but it remains unclear whether the source of saturation is presynaptic, postsynaptic, or both presynaptic and postsynaptic. To clarify this and other issues concerning the function of synapses, we have developed new recording and analysis methods at single central glutamatergic synapses. We find that individual release events engage a high proportion of postsynaptic receptors (62%), revealing a larger component of postsynaptic saturation than anticipated. Conversely, we also find that the number of released synaptic vesicles is limited at each active zone. Altogether, our results argue for both presynaptic and postsynaptic contributions to signal saturation at single glutamatergic synapses.

Keywords: AMPA receptor; cerebellum; glutamate; synaptic release; synaptic vesicles.


Figures

Figure 1.
Figure 1.
Decomposition of EPSCs. A flowchart shows the various steps involved in the decomposition of EPSCs. Starting from a response trace to a train of stimuli, individual EPSCs are selected during delayed release. After alignment, these EPSCs are averaged together, building the mEPSC average, and they are then fitted with a multiexponential curve, the template. Using the template, deconvolution is applied both to the original trace and to the mEPSC average, producing a deconvolved trace containing a series of spikes in the first case and a single spike in the second case. After fitting the deconvolved trace with appropriately scaled spikes, a series of events are identified. Finally, a table is produced listing each event together with its occurrence time and amplitude.
Figure 2.
Figure 2.
Local stimulation of PF–MLI connections. A, Schematics of recording conditions. In a parasagittal slice, the dendritic arborization of a recorded MLI is parallel to the slice surface (left, granule cell layer; right, molecular layer), whereas PFs are orthogonal to the MLI plane. GC, Granule cell; PC, Purkinje cells. A θ-glass pipette is positioned on top of the MLI arborization on the slice surface to stimulate presynaptic PFs. B, Representative experiment comparing the responsiveness of 4 presynaptic pipette positions located at the slice surface (green: somatodendritic domain and recording pipette; blue: axon; stimulation positions shown in enlarged image), with 2 responsive positions directly above the dendritic arborization and 2 other positions outside of the arborization (5 stimuli, 100 Hz; same stimulus conditions for all positions: 0.1 ms duration, 31 V amplitude). C, Group results from seven experiments as in B, where results from individual cells are color coded, showing a sharp drop of responsiveness (calculated as the mean EPSC integral for the first response) as a function of distance to the nearest dendrite. In each experiment, the stimulation intensity was adjusted such that at least one dendritic site would respond, and was then kept constant for all positions of the stimulation pipette. Open circles and associated error bars show binned averages ± SEM. The results are fitted with a constant (over a distance of 1.9 μm) followed with a half-Gaussian decay with an SD of 0.8 μm, so that responsive spots were located within a distance to the nearest dendrite of 1.9 + 0.8 = 2.7 μm. D, Intensity-response curve of a potential simple synapse. Left, Representative traces obtained with 3 stimulation intensities (stimulation duration: 0.1 ms; 3 superimposed traces at each intensity). Right, By careful selection of the presynaptic pipette position, it is possible to obtain a step-like intensity-response curve (dots: mean success probability for first stimulation; circles: mean current integral for successful first stimulations; error bars indicate ± SEM; n = 10–20 trials for each intensity) with a narrow transition region (here, at 30–35 V). A regression line through the first stimulation integral data points fails to reveal any significant relation to stimulation intensity. Such results are consistent with single PF stimulation. For simple synapse recording, stimulation intensity is set just above threshold (near 40–45 V in this example).
Figure 3.
Figure 3.
Event detection at a simple synapse. A, Responses to trains of APs (8 APs at 100 Hz; 10 s between trains) in a presumed simple synapse recording. Stimulation artifacts have been blanked, but stimulation times are marked with vertical lines. Responses appear as a mixture of failures, single EPSCs, and multiple EPSCs. After the end of the train, a period of delayed release was observed (∼50 ms in duration), during which quantal EPSCs could be isolated (square). B, Quantal EPSCs from the same experiment were aligned and averaged. The resulting average mEPSC was fitted with a sum of three exponentials, as indicated. A matched-filter was calculated from the 3-exponential fit, yielding the filtered version of the mEPSC shown below (“spike”: half peak amplitude width 0.38 ms). C, Applying the same matched filter to two individual EPSCs (first trial in A; responses to second and fifth stimulations) produces in one case, a single spike (left; dotted red line: spike-shaped curve with appropriate time positioning and vertical scaling; spike onset indicated by blue tick below) and, in the other case, a broader signal that can be decomposed into two components (dotted black curves; corresponding spike onsets indicated by blue ticks below; dotted red curve is the sum of the two components). D, Same analysis performed on a series of EPSCs (first trace in A), with the filtered trace below (calibration bar: spike amplitude for one quantum) and the resulting timing and amplitude of individual release events (blue trace).
Figure 4.
Figure 4.
Time resolution of event detection. A, Two experimentally recorded quantal EPSCs from the same experiment were artificially added together with various intervening time intervals ranging from 0 to 5 ms. The event detection procedure was run on these traces to determine the minimum interval required for event disambiguation. B, The procedure correctly discerned the 2 events down to a separation of 0.2 ms in the example shown in A (circles); for shorter intervals, a single event with double amplitude was reported. In another simulation, the second EPSC was scaled following an exponential function of the separation between the two EPSCs, to mimic amplitude occlusion (as detailed in Fig. 6–7). This gave the same time resolution (triangles). C, Group results from 25 experiments as in A indicate detection threshold with separations of 0.2 to 0.3 ms (closed symbols; associated error bars, when visible, indicate ± SEM). D, Associated amplitude measurements from the same experiments (upward triangles: amplitudes of first detected EPSCs; downward triangles, amplitudes of second detected EPSCs, when applicable; note double amplitude of single events for separations of 0–0.15 ms and intermediate amplitudes in 0.2–0.3 ms separation range).
Figure 5.
Figure 5.
Correction for missed events. A, Top trace, Average response to an 8 AP train (30 trials, 200 Hz; 3 mm Cao). Bottom, Comparison between the histogram of the timings of detected events (red, with associated left scale; binwidth, 0.2 ms) and the trace obtained by deconvolution of the average current response across trials (black). The black trace has been scaled such that the two curves are superimposed at late times (inset). B, Blow-up of the first two peak responses (respective stimulation times, 20 and 25 ms) showing a deficit of the red curve compared with the black one. This deficit represents undetected double events. To estimate it, areas are calculated under individual peak responses for the black and red curves. To compensate for the deficit, EPSCs are ranked in decreasing amplitude order and an appropriate number of the largest EPSCs are split into two immediately consecutive events.
Figure 6.
Figure 6.
Time-dependent amplitude occlusion in simple synapse recordings. A, Top, Representative traces from a presumed simple synapse recording (8 stimuli at 200 Hz, blue). In several cases (e.g., first, second, and third stimulations in first trace), double and triple responses are observed with smaller EPSC amplitudes for the second or third event compared with the first. Bottom, Stability of the summed number of released synaptic vesicles across trials (dotted line: average; traces in above panel correspond to trial numbers 25–27). B, Plot of EPSC amplitude as a function of Δt, the time interval since the previous event, reveals an amplitude drop for small Δt values (crosses: individual events; circles: averages of binned data). Extrapolation of the model exponential curve (red) to Δt = 0 suggests a maximum amplitude occlusion ω = 0.58 (see text). C, Uncorrected EPSC amplitude distribution from the experiment shown in A and B. Continuous curve: Gaussian fit (mean: 58 pA; CV: 0.53). D, Corrected amplitude distribution from the same experiment using the exponential curve shown in B for correction. The corrected amplitude distribution displays a higher mean, lower CV, and smaller skew than the uncorrected distribution. EG, As in BD, in another recording classified as originating from a multiple synapse. Here, the amplitude dependence on Δt is absent and the correction procedure does not affect significantly the amplitude distribution.
Figure 7.
Figure 7.
Amplitude occlusion in first EPSC pairs. A, In this analysis, amplitude occlusion is examined only for the first two EPSCs in a train stimulation, with amplitudes A1 and A2. B, The plot of A2 (as illustrated in A) as a function of Δt reveals a faster time constant and higher occupancy than that obtained with the preceding analysis on all events (1.2 vs 2.7 ms and 0.61 vs 0.58). Circles and associated error bars indicate binned data ± SEM. The asymptote (red) was constrained to fit the mean amplitude of isolated quantal events. Light gray area delimits the Δt range where event detection is ambiguous (Fig. 4). C, D, Group data analysis of amplitude occlusion, indicating higher amplitude occlusion (p < 0.05) and smaller recovery time constant (p < 0.01) for first-pairs analysis than for all-events analysis. In addition, the recovery time constant obtained with first-pairs analysis is slightly larger than the time constant of decay of miniature synaptic currents (p < 0.05). E, Two-component analysis distinguishes simple synapses (black) from multiple synapses (gray) based on peak amplitude CV (abscissa; calculated over the entire train period) and first-pairs amplitude occlusion (ordinate). Simple and multiple synapse outlines are drawn empirically around corresponding clusters.
Figure 8.
Figure 8.
Mean and CV of peak amplitudes in simple synapse experiments. A, Representative superimposed EPSCs from a simple synapse experiment illustrating first events, showing large and homogeneous amplitudes; train events, showing more heterogeneous, somewhat smaller amplitudes (reflecting receptor activation and desensitization from previous events); delayed-release events, also with smaller amplitudes (reflecting cumulative desensitization). Right, Spontaneous events (from another recording), with very heterogeneous amplitudes (reflecting mixed contributions from several synapses; mean: 86 pA, CV: 0.50). Amplitude histograms with Gaussian fits are shown below each set of traces (right: with superimposed normalized Gaussian fits of first, train, and delayed traces). Respective mean and CV values: 117 pA, 0.23 (green); 89 pA, 0.36 (blue); 77 pA, 0.40 (red). B, Group data from 24 simple synapse experiments showing mean and CV of peak amplitudes for first events (after exclusion of presumed double events, following the criterion of Fig. 5), train events (after correction for amplitude occlusion from previous events), and delayed events. Data for spontaneous events are also shown for comparison (n = 13). First events display larger mean amplitude than train events or delayed events (p < 0.001 in each case). They also display a lower CV than train events (p < 0.001) and delayed events (p < 0.05). Spontaneous events have a mean that is not different from that of first events, train events, or delayed events. However, they have a CV that is larger than that of first, train, or delayed events (p < 0.001 in each case). C, Plot of EPSC amplitudes (left) and CV (right) as a function of their order of appearance in each trace. Results were corrected as in Figure 6. They were normalized in each experiment with respect to the amplitude of the first EPSC and were averaged across 11 experiments performed at 200 Hz stimulation. The amplitude plot shows a continuous decline and can be fitted with a line having a slope of 3% per EPSC (red). The CV increases from the first to the second EPSC and stabilizes thereafter.
Figure 9.
Figure 9.
Counts of vesicular release events per AP follow binomial statistics. A, Matrix of vesicular release counts (color coded) as a function of stimulus number (columns; 100 Hz stimulation) and trial number (rows). B, For each stimulus number, the mean and variance of the number of released vesicles was determined in a 5 ms period after individual stimulations (dots). Stimulation numbers are indicated; note that the vesicle counts for the sixth and seventh stimuli are identical, so that the corresponding dots are superimposed. The resulting curve can be fitted with a parabola indicating a number N = 2.6 of releasing units and a maximum release probability (for the first stimulus) P = 0.69. For late stimuli, experimental points are close to the y = x line that would be predicted for a Poisson model. C, Here, the probability distribution p(k) to observe k vesicular release events is displayed for the first stimulus in A. As can be seen in the first column in A, k varies between 0 and 3, with 5 observations of k = 3, and 0 observation of k > 3. The experimental data (dots) are compared with two Poisson models, one with the same mean release number as the data (λ = 1.8; blue) and the other with the same failure number as the data (λ = 3.4; green). In both cases, poor fits are obtained. In contrast, the binomial model approximates the data closely (red; N = 3; mean probability P = 0.59; see Materials and Methods). D, Distributions of N values obtained with the variance–mean parabola (red) and with a binomial fit (black). E, Plot of the N value obtained by extrapolation of the parabolic fit to variance data, as in B, as a function of binomial N, obtained from the stimulus with maximum release probability by the method illustrated in C. Depending on the experiment, this maximum occurred for the first stimulation (as in the case shown in A), or for the second stimulation. The 2 N estimates are significantly correlated (black regression line; p < 0.001) and the regression line passing through the origin (red) has a slope of 1.3. F, Corresponding plot of the maximum release probability with the two methods. Again, the two estimates are significantly correlated (black regression line; p < 0.05) and the regression line passing through the origin (red) has a slope of 0.83.

Similar articles

Cited by

References

    1. Abrahamsson T, Cathala L, Matsui K, Shigemoto R, Digregorio D. Thin dendrites of cerebellar interneurons confer sublinear synaptic integration and a gradient of short-term plasticity. Neuron. 2012;73:1159–1172. doi: 10.1016/j.neuron.2012.01.027. - DOI - PubMed
    1. Andor-Ardó D, Keen EC, Hudspeth AJ, Magnasco MO. Fast, automated implementation of temporally precise blind deconvolution of multiphasic excitatory postsynaptic currents. PLoS One. 2012;7:e38198. doi: 10.1371/journal.pone.0038198. - DOI - PMC - PubMed
    1. Atluri PP, Regehr WG. Delayed release of neurotransmitter from cerebellar granule cells. J Neurosci. 1998;18:8214–8227. - PMC - PubMed
    1. Auger C, Marty A. Heterogeneity of functional synaptic parameters among single release sites. Neuron. 1997;19:139–150. doi: 10.1016/S0896-6273(00)80354-2. - DOI - PubMed
    1. Auger C, Marty A. Quantal currents at single-site central synapses. J Physiol. 2000;526:3–11. doi: 10.1111/j.1469-7793.2000.t01-3-00003.x. - DOI - PMC - PubMed

Publication types

LinkOut - more resources