

An On-Chip Disposable Salivary Glucose Sensor for Diabetes Control
- PMID: 27053256
- PMCID: PMC5094318
- DOI: 10.1177/1932296816642251
An On-Chip Disposable Salivary Glucose Sensor for Diabetes Control
Abstract
Background: Self-management of blood glucose (BG) is considered a norm for diabetes control. However, this invasive process is uncomfortable for patients, especially when intensive measurements with frequent finger pricks are required. Saliva, an alternative body fluid that is easily accessible and contains trace amount of glucose can be potentially used for the noninvasive monitoring of diabetes.
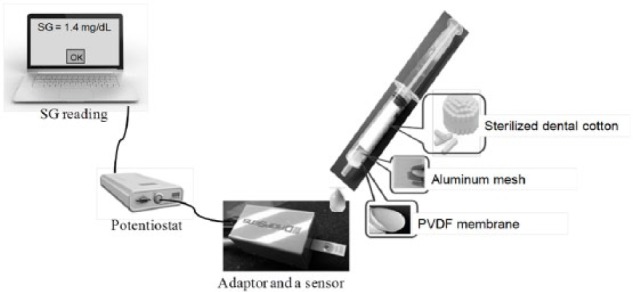
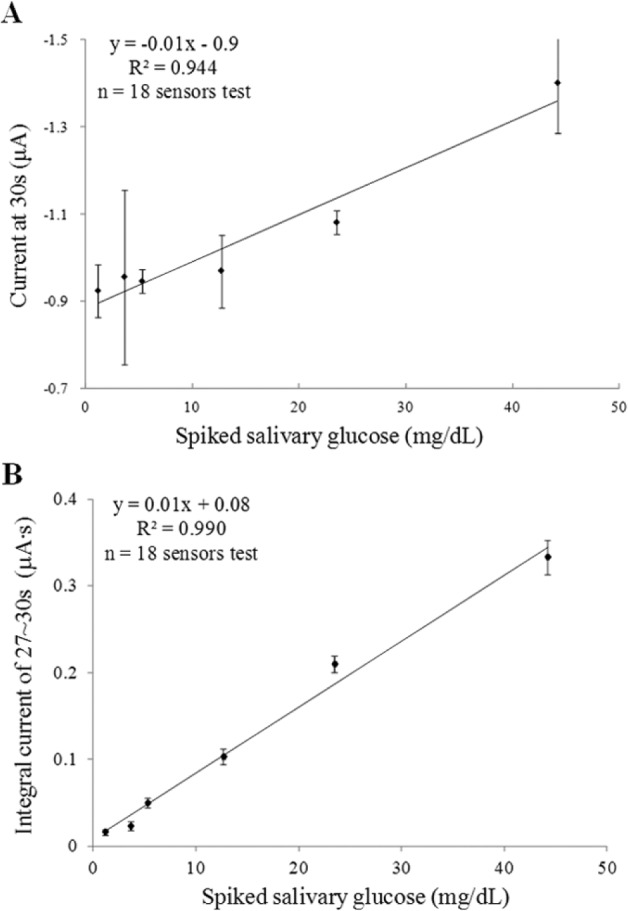
Methods: As a solution for real-time glucose measurements using saliva for diabetic care, we have developed an on-chip disposable glucose nano-biosensor through a layer-by-layer assembly process. In this work, a clinical study of 10 healthy subjects was conducted to determine the potential usefulness of salivary glucose (SG) sensors for glycemic control.
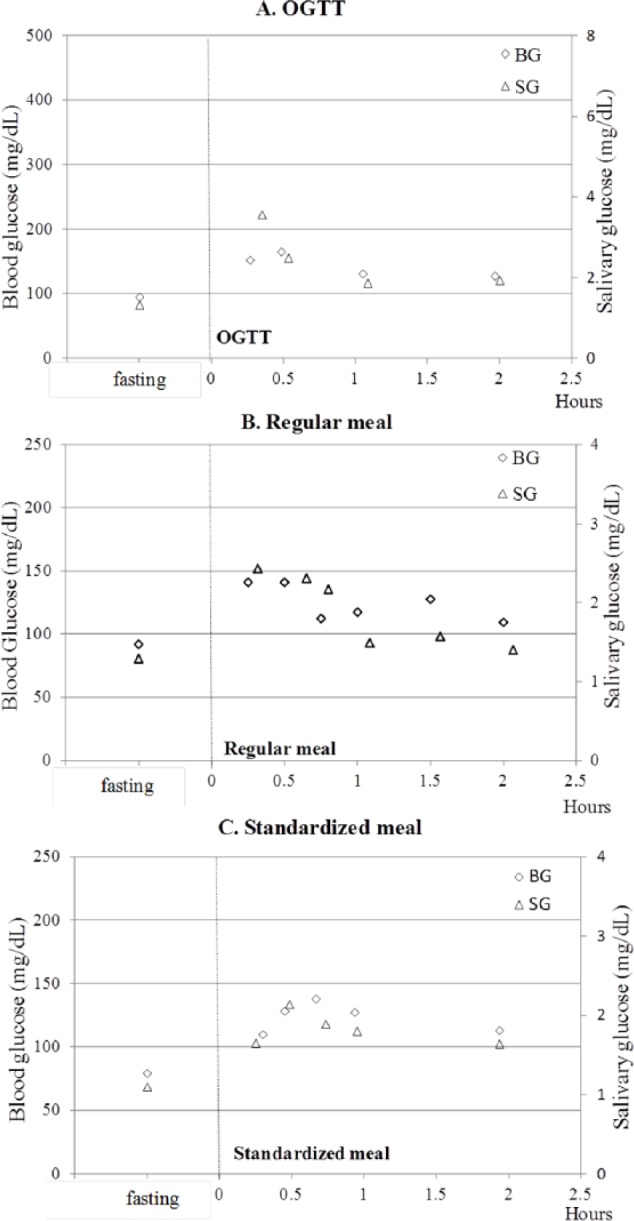
Results: Findings revealed (1) the individual BG/SG ratio at fasting was consistent over an entire year when there was no significant change of personal health; (2) the individual SG levels tracked closely with BG levels after meals; (3) a time difference of 15-30 minutes exists between peak levels of BG and SG; (4) 2 hours after a meal, the BG/SG ratio returned to a similar value at fasting.
Conclusions: We propose to measure fasting and pre- and 2-hour postprandial SG levels for self-management of glycemic levels. As a result, this article is not intended to replace the common BG tests. With preliminary results, we believe SG itself could be used as means for reliable diabetes monitoring and a potential fluid for prognosis of future disease.
Keywords: biochemistry; diabetes; enzymology; oral diagnosis; saliva; salivary diagnostics.
© 2016 Diabetes Technology Society.
Conflict of interest statement
The author(s) declared no potential conflicts of interest with respect to the research, authorship, and/or publication of this article.
Figures


References
-
- International Diabetes Federation. IDF Diabetes Atlas. 6th ed. Brussels, Belgium: International Diabetes Federation; 2013.
-
- Centers for Disease Control and Prevention. Estimates of Diabetes and Its Burden in the United States. Atlanta, GA: CDC; 2014.
Publication types
MeSH terms
Substances
LinkOut - more resources
Full Text Sources
Other Literature Sources
Medical
Research Materials
