Comparative Study
. 2016 Apr;4(7):e12762.
doi: 10.14814/phy2.12762.

Multiple sites of adaptation lead to contrast encoding in the Drosophila olfactory system

Affiliations
Comparative Study

Multiple sites of adaptation lead to contrast encoding in the Drosophila olfactory system

Jon Cafaro. Physiol Rep. 2016 Apr.

Abstract

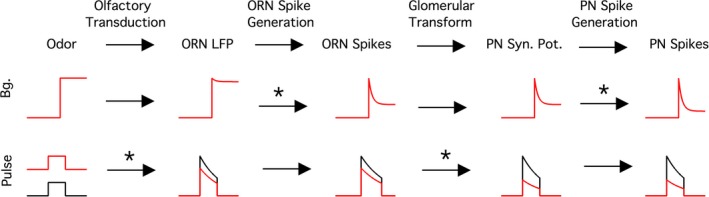
Animals often encounter large increases in odor intensity that can persist for many seconds. These increases in the background odor are often accompanied by increases in the variance of the odor stimulus. Previous studies have shown that a persistent odor stimulus (odor background) results in a decrease in the response to brief odor pulses in the olfactory receptor neurons (ORNs). However, the contribution of adapting mechanisms beyond theORNs is not clear. Thus, it is unclear how adaptive mechanisms are distributed within the olfactory circuit and what impact downstream adaptation may have on the encoding of odor stimuli. In this study, adaptation to the same odor stimulus is examined at multiple levels in the well studied and accessibleDrosophilaolfactory system. The responses of theORNs are compared to the responses of the second order, projection neurons (PNs), directly connected to them. Adaptation inPNspike rate was found to be much greater than adaptation in theORNspike rate. This greater adaptation allowsPNs to encode odor contrast (ratio of pulse intensity to background intensity) with little ambiguity. Moreover, distinct neural mechanisms contribute to different aspects of adaptation; adaptation to the background odor is dominated by adaptation in spike generation in bothORNs andPNs, while adaptation to the odor pulse is dominated by changes within olfactory transduction and the glomerulus. These observations suggest that the olfactory system adapts at multiple sites to better match its response gain to stimulus statistics.

Keywords: Adaptation; Drosophila; Olfaction; Weber's law.


Figures

Figure 1
Figure 1
Odor stimulation and measurement of stimulus using photoionization detector (PID). (A) Private odor predominately activates ORNs presynaptic to VM7 PNs and thus minimizes lateral interactions; and a public odor activates multiple ORN classes. (B) Schematic illustrating the air flow pathway and valves (V.) used to control the odor stimuli. (C) The average (N = 10 trials) PID responses (bottom trace) to 2‐butanone odor stimulus protocols used (top trace) to measure neural activity. Each trace shows the response to background and pulse odor at the same concentration (10−7 pulse on 10−7 background etc.). D‐F, Quantification of the pulse stimulus. The response of the PID to background odor is subtracted. (D) The average pulse response of the PID without (solid) or with the paraffin oil response subtracted (dashed lines) is plotted as a function of pulse odor concentration. At low odor concentrations, the PID response is dominated by the solvent, paraffin oil. Within margins of error, the PID responses are linearly related to the odor concentration. “P” on the X‐axis is paraffin oil alone. Error bars indicate Standard error of the means (SEMs). Gray point, indicates the PID response to the paraffin oil pulse alone. Inset, shows that the paraffin oil PID response (gray) is similar to the response to 2‐butanone at 10−7 concentration, which includes responses due to both paraffin oil and odor (black). Scale bars are 5 mV, 500 msec. (E) The PID pulse response as a function of time in the presence of background odor (colored) and its absence (black) shows that PID responses are similar with and without background. Background and pulse odor intensity are the same and listed to the left of each trace. Scale bars are 5 mV, 500 msec. F, The average peak PID pulse response during the highest background odor stimulus (10−4; red points and line) and in its absence (black circles). Insets show the PID pulse responses as a function of time in the presence (red) and absence (black) of the odor background for a select set of responses. Scale bars are 5 mV, 500 msec. G, The average peak PID pulse response in the absence of a background stimulus (black points and solid curve) and the steady‐state PID voltage during the background of the same odor concentration. The dashed line is a shifted version of the PID pulse peak curve obtained by multiplying a single scale factor (~4) chosen to match the PID steady‐state response. The pulse and background concentrations are, therefore, related to each other by a single scale factor. The inset shows the PID pulse response (black) at 10−7 concentration and the PID response during the background stimulus of the same intensity (blue).
Figure 2
Figure 2
Experimental design and basic phenomena. A‐B. Adaptation is measured at four levels in the circuits. Two of the signals are obtained from ORN recordings and are shown in panel A. The other two signals are obtained from PN recordings and shown in panel B. (A) ORN responses were recorded with a sharp electrode inserted into the pb1 sensilla. pb1 sensilla in the Or71a mutants have one functional ORN, pb1A, and one nonfunctional, pb1B. Sample trace shows the response of a pb1A ORN to a pulse of 2‐butanone ([10−6]). Response to odor consists of a slow signal, as well as, spikes. Smoothing isolated the slow signal, which is a measure of the transduction step. Spikes are measured separately. (B) PN responses were recorded with whole‐cell patch‐clamp and data were analyzed similarly to the ORN. (C) The background odor intensity is color coded and indicated at the top right of the panel. Top traces show a schematic of the odor stimulus command. Bottom traces, show ORN and PN spike responses to a 10−4 pulse during a range of background odor intensities. Responses were averaged across trials and cells. ORN spikes are an average of (N = 4–11 trials) and (N = 5–6 cells). PN spikes are averaged across (N = 3–10 trials) and (N = 5–7 cells).
Figure 3
Figure 3
Adaptation of the odor background response. (A) The average (N = 5–9 cells, 3–63 trials per cell) normalized ORN LFP and spike rate response at different odor backgrounds. (B) The ratio of plateau to transient peak spike rate plotted against the plateau to peak ratio for the ORN LFP shows that the adaptation is stronger at the level of ORN spikes. Error bars are not shown for clarity. (C‐D), The same as A‐B but for PNs (N = 5–9 cells, 4–39 trials per cell). (E) Average plateau/peak ratio at each neural stage and background odor intensity shows greater adaptation in the ORN spikes than ORN LFP at the high background concentration. Background adaptation is strongest at the level of PN spikes. Error bars are Standard error of the means (SEMs) across cells. Asterisks indicate significant differences between paired data in panels B, D at each background odor intensity (P < 0.05 in a paired t‐test).
Figure 4
Figure 4
Adaptation of the pulse response at one odor pulse intensity (10−4) (A) ORN LFP pulse response averaged across trials (N = 4–11 trials) and cells (N = 5–6 cells). The pulse response was calculated by subtracting the background activity in the 5 sec preceding the pulse. (B) The peak of the pulse response in each cell in the absence (X‐axis) and presence (Y‐axis) of the background odor shows that there is significant adaptation only for the two highest concentrations. Error bars are not shown for clarity. (C) The peak of a cell's pulse response in the presence of a background odor divided by its peak in the absence, averaged across all cells. Error bars are Standard error of the means (SEMs). Asterisks indicate significant adaptation between paired data in panel B (P < 0.05 in a paired t‐test) for a given background odor intensity. (D‐F) As in A‐C, but using ORN spike rate data (N = 4–11 trials and 5–6 cells). Lines show interpolated fits from panels C and F. G‐I, As in A‐C, but using PN synaptic potential data (N = 3–10 trials and 5–7 cells). J‐L, As in A‐C, but using PN spike rate data (N = 3–10 trials and 5–7 cells). Lines show interpolated fits from panels I and L.
Figure 5
Figure 5
Adaptation of the pulse response across multiple odor pulse intensities. (A) The mean LFP peak pulse response curves (N = 5–9 cells, 3–21 trials per cell) for each background odor intensity calculated using the normalization procedure. Error bars indicate Standard error of the means (SEMs), propagated from paired data (Methods). (B) As in panel A, but using ORN spike rate data. (C) As in panel A, but using PN synaptic potential data (N = 5–9 cells, 3–10 trials per cell). (D) As in panel A, but using PN spike rate data. E‐G. Output of each stage plotted as a function of its input to assess the adaptation at a given stage. E. ORN LFP (Y‐values from panel A) plotted against ORN spikes (Y‐values from panel B), reflecting ORN spike generation F, ORN spikes (Y‐values from panel B) plotted against PN synaptic potential (Y‐values from panel C), reflecting the glomerular transform. Only responses to the same pulse value were plotted. The inset shows the average ORN spike pulse responses from the points within the dashed box. G, PN synaptic potential (Y‐values from panel C) plotted against PN spikes (Y‐values from panel D), reflecting PN spike generation.
Figure 6
Figure 6
PNs encode contrast better than ORNs. (A) The mean LFP peak pulse response curves for each background odor intensity calculated as in Fig. 5A, but plotted against odor contrast (odor pulse intensity/odor background intensity), not pulse intensity. (B) As in panel A, but using ORN spike rate data. (C) As in panel A, but using PN synaptic potential data. (D) As in panel A, but using PN spike rate data.
Figure 7
Figure 7
Full pulse response including background activity. (A) ORN LFP full pulse response averaged across trials (N = 4–11 trials) and cells (N = 5–6 cells) for the 10−4 odor pulse intensity. In this case, the response to the background odor was not subtracted from the pulse response as in Fig. 4A. B, The mean LFP peak full pulse response curves (N = 5–9 cells, 3–21 trials per cell) for each background odor intensity was calculated by adding the average background activity to the pulse response curves in Fig. 6A. Each response curve is plotted as a function of pulse odor contrast. C‐D, As in panels A‐B, but using ORN spike rate data. E‐F, As in panels A‐B, but using PN synaptic potential data. G‐H, As in panels A‐B, but using PN spike rate data.
Figure 8
Figure 8
Adaptation during public odor (ethyl acetate) response. A, Adaptation to background odor in ORNs. As with the private odor (Fig. 3), ORN spikes adapt more than the LFP. B, PN spikes adapt more than the PN synaptic potential. C‐F. Pulse adaptation at the four sites studied here shows that pulse adaptation in the ORN (N = 5 cells, 10–20 trials per cell) is small, while that in PNs (N = 5 cells, 8–12 trials per cell) is more substantial. Adaptation at the level of synaptic potential contributes most to pulse adaptation. Similarity is evident between the PN spike response of the single contrast delivered. Right panel in F is same as left panel but response is plotted as function of pulse/bg. Background concentrations are color coded as in panel A. G‐J. As in panels C‐F, but using the full pulse response (without subtracting the background response) data. Adaptation is now most prominent in the PN spike rate.
Figure 9
Figure 9
Summary of major sites of background and pulse adaptation. Simulated data of responses at each site with (red) and without (black) a background odor present. Major observed sites of adaptation are indicated with asterisks.

References

    1. Angueyra, J. M. , and Rieke F.. 2013. Origin and effect of phototransduction noise in primate cone photoreceptors. Nat. Neurosci. 16:1692–1700. - PMC - PubMed
    1. Barlow, H. B. 1961. Possible principles underlying the transformations of sensory messages Pp. 217–234 in Rosenblith W., ed. Sensory communication. Ch13. M.I.T. Press, Cambridge, MA:
    1. Bhandawat, V. , Olsen S. R., GouIns N. W., Schlief M. L., and Wilson R. I.. 2007. Sensory processing in the Drosophila antennal lobe increases reliability and separability of ensemble odor representations. Nat. Neurosci. 10:1474–1482. - PMC - PubMed
    1. Brown, S. L. , Joseph J., and Stopfer M.. 2005. Encoding a temporally structured stimulus with a temporally structured neural representation. Nat. Neurosci. 8:1568–1576. - PubMed
    1. de Bruyne, M. , Clyne P. J., and Carlson J. R.. 1999. Odor coding in a model olfactory organ: the Drosophila maxillary palp. J. Neurosci. 19:4520–4532. - PMC - PubMed

Publication types

LinkOut - more resources