. 2016 Jun;26(6):719-31.
doi: 10.1101/gr.201517.115. Epub 2016 Apr 6.

Three-dimensional disorganization of the cancer genome occurs coincident with long-range genetic and epigenetic alterations

Affiliations

Three-dimensional disorganization of the cancer genome occurs coincident with long-range genetic and epigenetic alterations

Phillippa C Taberlay et al. Genome Res. 2016 Jun.

Abstract

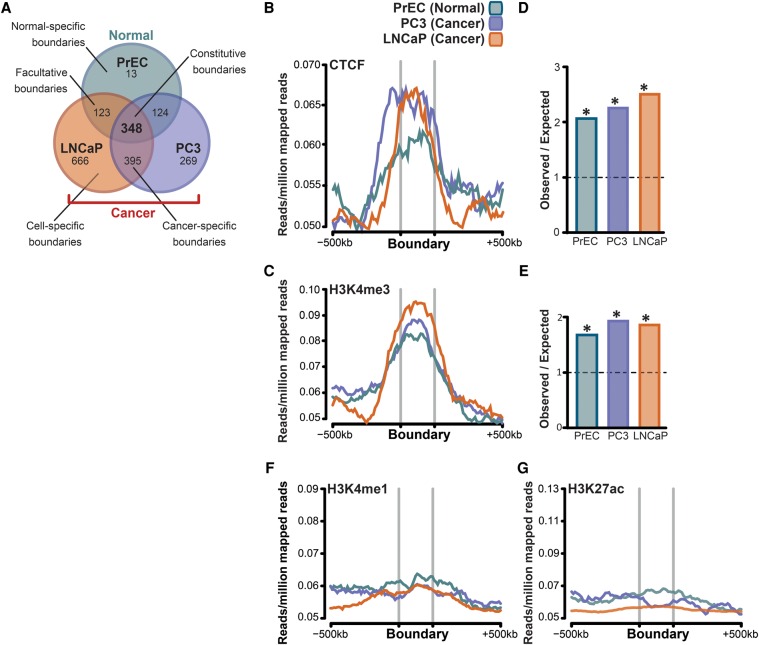
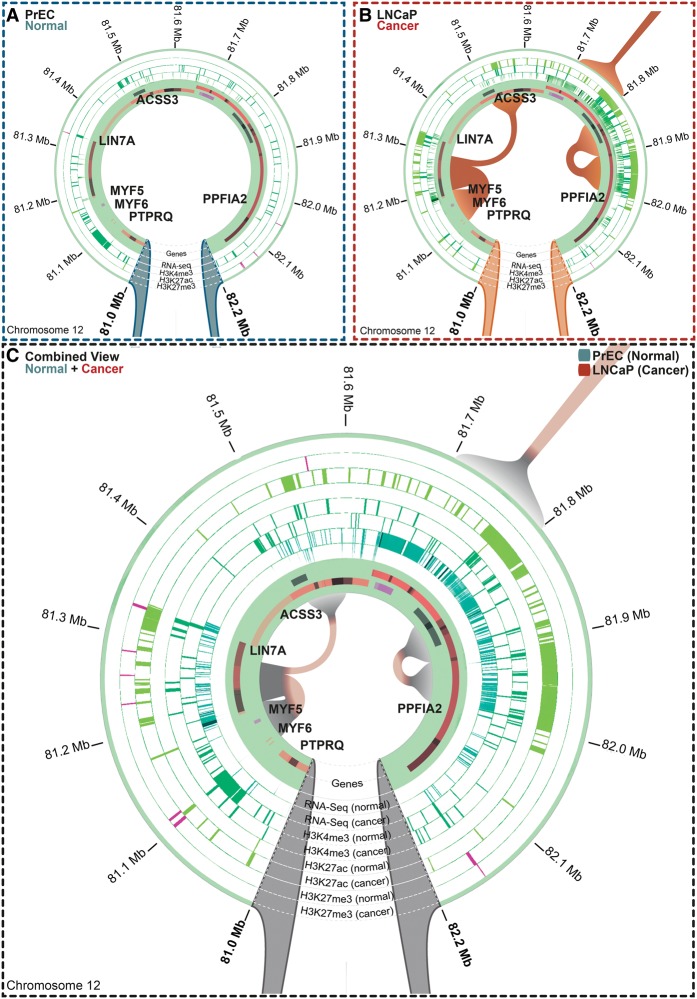
A three-dimensional chromatin state underpins the structural and functional basis of the genome by bringing regulatory elements and genes into close spatial proximity to ensure proper, cell-type-specific gene expression profiles. Here, we performed Hi-C chromosome conformation capture sequencing to investigate how three-dimensional chromatin organization is disrupted in the context of copy-number variation, long-range epigenetic remodeling, and atypical gene expression programs in prostate cancer. We find that cancer cells retain the ability to segment their genomes into megabase-sized topologically associated domains (TADs); however, these domains are generally smaller due to establishment of additional domain boundaries. Interestingly, a large proportion of the new cancer-specific domain boundaries occur at regions that display copy-number variation. Notably, a common deletion on 17p13.1 in prostate cancer spanning the TP53 tumor suppressor locus results in bifurcation of a single TAD into two distinct smaller TADs. Change in domain structure is also accompanied by novel cancer-specific chromatin interactions within the TADs that are enriched at regulatory elements such as enhancers, promoters, and insulators, and associated with alterations in gene expression. We also show that differential chromatin interactions across regulatory regions occur within long-range epigenetically activated or silenced regions of concordant gene activation or repression in prostate cancer. Finally, we present a novel visualization tool that enables integrated exploration of Hi-C interaction data, the transcriptome, and epigenome. This study provides new insights into the relationship between long-range epigenetic and genomic dysregulation and changes in higher-order chromatin interactions in cancer.


Figures

Figure 1.
Figure 1.
Topologically associated domains (TADs) are smaller but maintained across the cancer cell genome. (A) Number and average size (in Mb) of TADs identified in normal prostate epithelial cells (PrEC) and prostate cancer cells (PC3 and LNCaP). (B) Chromatin interaction heat maps from PrEC, PC3, and LNCaP cells visualized as two-dimensional interaction matrices in WashU Epigenome Browser. TADs observed in cancer cells are often “merged” in normal cells, and large domains found in normal cells are frequently occupied by more than two domains in cancer cells. The interaction data are aligned with RefSeq genes and CTCF binding sites. An example from Chromosome 1 is shown. (C) Proportion of the genome (%) organized into TADs, associated with domain boundaries, or unorganized chromatin.
Figure 2.
Figure 2.
Cancer cells acquire unique topological domain boundaries that retain CTCF binding and enrichment for H3K4me3. (A) Venn diagram showing that the majority of domain boundaries that are present in normal cells (PrEC) are also present in cancer cells (constitutive boundaries; PC3 and LNCaP), while ∼20% of boundaries were maintained in only one of the two cancer cells (cell-type–specific boundaries). (B,C,F,G) Genome-wide average distribution of CTCF, H3K4me3, H3K4me1, and H3K27ac binding around the domain boundaries in PrEC, PC3, and LNCaP cells. (D) Fold enrichment of CTCF binding at the domain boundaries in PrEC, PC3, and LNCaP cells compared to that expected by chance. (E) Fold enrichment of H3K4me3 binding at the domain boundaries in PrEC, PC3, and LNCaP cells compared to that expected by chance.
Figure 3.
Figure 3.
Copy-number variants (CNVs) are associated with the formation of new domain boundaries in cancer cells. CNV regions visualized as relative copy-number estimates for each cell type (presented in green) are aligned with chromatin interaction heat maps (presented as normalized interaction counts visualized in WashU Epigenome Browser) and TADs, demonstrating that cancer-specific domain boundaries are located at regions of CNVs in cancer cell lines. The location of RefSeq genes in the region of copy-number variation is indicated below. An example from Chromosome 17 is shown, where a 400- to 600-kb deletion encompassing the TP53 locus that is present in both cancer cell lines is associated with establishment of a new domain boundary and a resulting change in local interactions across this region.
Figure 4.
Figure 4.
New, cancer-specific interactions explain the majority of differential interactions, which remain within topological domains. (A) Anchor points of chromatin interactions were defined as the genomic locations where an interaction is present. Genomic coordinates of anchor points were exported into a BED file for further analysis. (B) Venn diagram showing anchor points of differential interactions between PrEC and PC3 and between PrEC and LNCaP cell lines (FDR < 5%) and the overlap between them. (C) Differential interactions are enriched in cancer cells. (D) Differential interactions are enriched for enhancers that were marked by CTCF (enhancer + CTCF), promoters marked by CTCF (promoter + CTCF), as well as distal CTCF sites (CTCF). ChIP-seq chromatin states were classified using the ChromHMM hidden Markov model, and data are presented as fold change between the observed enrichment and that expected by random chance. Enrichment was considered significant if the q value < 0.05. (E) Differential interactions are associated with significantly altered gene expression in cancer cells (χ2 OR = 2.482 [95% CI = 1.141–5.400], P = 0.0273). (F) Majority of genes located at the anchor points of differential interactions have increased expression in cancer cells.
Figure 5.
Figure 5.
Differential interactions are enriched for enhancers, promoters, and CTCF-occupied genomic regions and may explain the unique epigenetic programs of normal and cancer cells. Chromatin interactions visualized in the Rondo interactive analysis tool. Anchor points of differential interactions are visualized simultaneously with ChIP-seq (H3K27ac, H3K4me1, H3K4me3), RefSeq genes, and RNA-seq data (circular tracks) inferring functionality (both active and repressive) of interactions. (A) In this example from Chr10:33,000,000–35,000,000, epigenetic remodeling (activation) of genes located at the differentially interacting region can be observed at 100-kb resolution. The promoter and a putative enhancer of the NRP1 gene are both marked by residual H3K4me1 in normal cells. Very little H3K4me3 (dark green) and H3K27ac (light green) is observed. (B) In contrast, these regulatory elements display a marked increase in H3K4me1, H3K4me3, and H3K27ac ChIP signal in PC3 prostate cancer cells, indicative of increased gene activity. This occurs concomitant with a new interaction depicted by the purple line in the cancer cells. (C) Genes at differential interaction anchor points are significantly overexpressed concomitant with a new interaction only present in the cancer cells (*q value < 0.0001).
Figure 6.
Figure 6.
Long-range epigenetically silenced (LRES) domains occur at differential interactions in cancer cells. The majority of LRES regions overlap differential interactions in cancer cells. Anchor points of differential interactions are visualized in Rondo simultaneously with ChIP-seq (H3K27ac, H3K4me3, and H3K27me3), RefSeq genes, and RNA-seq data. (A) In normal PrEC cells, three chromatin interactions (teal) are present across the LRES region within Chr1:207,900,000–209,800,000, which contains highly expressed genes (RNA-seq) and enriched levels of active histone marks (H3K4me3, dark green; H3K27ac, light green). (B) In LNCaP cancer cells, new interactions are observed in this LRES region and occur with concomitant loss of gene expression (RNA-seq) and a marked decrease in active marks (H3K4me3, dark green; H3K27ac, light green) and increase in repressive H3K27me3 (pink). (C) A combined view shows normal and cancer epigenomes, expression and interaction data simultaneously. Those interactions unique to PrEC (normal; teal) and LNCaP (cancer; orange) are evident, while the shared interaction is shown in yellow. The circular tracks depict gene expression (RNA-seq) and histone marks (H3K4me3, dark green; H3K27ac, light green; H3K27me3, pink). Teal lines in the circle depict a loss of chromatin interactions in cancer, and the orange lines depict a gain of interaction in the cancer cells.
Figure 7.
Figure 7.
Long-range epigenetically activated (LREA) domains occur at differential interactions in cancer cells. The majority of LREA regions overlap differential interactions in cancer cells. Anchor points of differential interactions are visualized in Rondo simultaneously with ChIP-seq (H3K27ac, H3K4me3, and H3K27me3), RefSeq genes, and RNA-seq data. (A) In normal PrEC cells, there are no interactions evident across the LREA region within Chr12:81,000,000–82,200,000, which is consistent with the low levels of H3K4me3 (dark green), absence of H3K27ac (light green), and gene inactivity (RNA-seq, dark cyan). (B) In LNCaP prostate cancer cells, three new, distinct interactions (orange) are observed. Most of the genes are highly expressed (RNA-seq) and active marks (H3K4me3, dark green; H3K27ac, light green) are acquired. This region is devoid of repressive H3K27me3 marks (pink). (C) A combined view shows normal and cancer epigenomes, expression and interaction data simultaneously. Only interactions present in LNCaP (cancer; orange) are evident, with no shared interactions. The circular tracks depict gene expression (RNA-seq) and histone marks (H3K4me3, dark green; H3K27ac, light green; H3K27me3, pink).

References

    1. Ahmadiyeh N, Pomerantz MM, Grisanzio C, Herman P, Jia L, Almendro V, He HH, Brown M, Liu XS, Davis M, et al. 2010. 8q24 prostate, breast, and colon cancer risk loci show tissue-specific long-range interaction with MYC. Proc Natl Acad Sci 107: 9742–9746. - PMC - PubMed
    1. Akhtar-Zaidi B, Cowper-Sal-lari R, Corradin O, Saiakhova A, Bartels CF, Balasubramanian D, Myeroff L, Lutterbaugh J, Jarrar A, Kalady MF, et al. 2012. Epigenomic enhancer profiling defines a signature of colon cancer. Science 336: 736–739. - PMC - PubMed
    1. Bengtsson H, Irizarry R, Carvalho B, Speed TP. 2008. Estimation and assessment of raw copy numbers at the single locus level. Bioinformatics 24: 759–767. - PubMed
    1. Bengtsson H, Wirapati P, Speed TP. 2009. A single-array preprocessing method for estimating full-resolution raw copy numbers from all Affymetrix genotyping arrays including GenomeWideSNP 5 & 6. Bioinformatics 25: 2149–2156. - PMC - PubMed
    1. Bert SA, Robinson MD, Strbenac D, Statham AL, Song JZ, Hulf T, Sutherland RL, Coolen MW, Stirzaker C, Clark SJ. 2013. Regional activation of the cancer genome by long-range epigenetic remodeling. Cancer Cell 23: 9–22. - PubMed