. 2016 Jun 1;27(11):1863-74.
doi: 10.1091/mbc.E15-12-0854. Epub 2016 Apr 6.

Combined changes in Wnt signaling response and contact inhibition induce altered proliferation in radiation-treated intestinal crypts

Affiliations

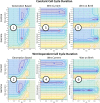
Combined changes in Wnt signaling response and contact inhibition induce altered proliferation in radiation-treated intestinal crypts

S-J Dunn et al. Mol Biol Cell. .

Abstract

Curative intervention is possible if colorectal cancer is identified early, underscoring the need to detect the earliest stages of malignant transformation. A candidate biomarker is the expanded proliferative zone observed in crypts before adenoma formation, also found in irradiated crypts. However, the underlying driving mechanism for this is not known. Wnt signaling is a key regulator of proliferation, and elevated Wnt signaling is implicated in cancer. Nonetheless, how cells differentiate Wnt signals of varying strengths is not understood. We use computational modeling to compare alternative hypotheses about how Wnt signaling and contact inhibition affect proliferation. Direct comparison of simulations with published experimental data revealed that the model that best reproduces proliferation patterns in normal crypts stipulates that proliferative fate and cell cycle duration are set by the Wnt stimulus experienced at birth. The model also showed that the broadened proliferation zone induced by tumorigenic radiation can be attributed to cells responding to lower Wnt concentrations and dividing at smaller volumes. Application of the model to data from irradiated crypts after an extended recovery period permitted deductions about the extent of the initial insult. Application of computational modeling to experimental data revealed how mechanisms that control cell dynamics are altered at the earliest stages of carcinogenesis.


Figures

FIGURE 1:
FIGURE 1:
The structure of intestinal crypts. (a) Cartoon image of a single crypt, illustrating the decreasing concentration gradient of Wnt along the long crypt axis and highlighting the stem cell compartment, which consists of the stem and Paneth cells. Nuclei displaced to the apical surface represent mitotic cells. (b) 3D reconstruction of a single crypt, with the red surface corresponding to the lumen and the blue surface the basal surface of a crypt outlining its shape. This is used to define the dimensions of the computational crypt model (Materials and Methods). (c) 3D computational crypt model. Stem cells are blue, transit cells are yellow, differentiated cells are pink, and Paneth cells are black.
FIGURE 2:
FIGURE 2:
Experimental data illustrating the change in the distribution of mitotic cells that occurs in response to tumor-inducing radiation. Mitotic distributions from Trani et al. (2014) in crypts from the middle of the small intestine (jejunum) of male control mice (left), male mice irradiated with 4 Gy of γ-radiation after a 48-h recovery period (middle), and mice irradiated and allowed to recover for 3 mo (right). Top, raw data are plotted as a bar histogram together with a smoothed data distribution (blue curve), which is the data fitted to a nonparametric kernel-smoothing distribution (with normal distribution and a bandwidth of 10). Bottom, a sample from the smoothed distribution to illustrate the “smoothed data” that are subsequently used for parameter fitting.
FIGURE 3:
FIGURE 3:
Example of a 2D parameter sweep for model 6. The effect of increasing the volume threshold for contact inhibition (x-axis) and decreasing the Wnt concentration threshold (y-axis) on the distribution of mitotic cells. The optimal parameter set to fit to the control data are highlighted in blue (0.9, 0.6), the 48-h γ-irradiated crypts in red (0.6, 0.5), and the 3-mo recovered crypts in green (0.8, 0.5). The shaded regions have an error that is within 25% of the optimal parameters. These results illustrate that the effect of irradiation within model 6 is both to decrease the Wnt threshold concentration and lower the volume threshold for contact inhibition: cells can divide at much lower volumes and under a lower Wnt stimulus to cause widening of the mitotic distribution.
FIGURE 4:
FIGURE 4:
The log of the error between the simulated and experimental data varies with the parameters implemented in each model. Model numbers are indicated on each plot. The red and blue circles mark the minimum error for the control and irradiated cases, respectively. The first contour is within 25% of the minimum, the second contour within 200%, the third within 400%, and so on. In all models except model 2, the parameter sets that produce the minimum error in each case reveal that the proliferation (Wnt concentration) threshold and the volume threshold decrease from the control to the γ-irradiated case.
FIGURE 5:
FIGURE 5:
Colonization of a crypt by mutant cells. (a) The probability that a population of mutant cells will colonize an entire crypt for different starting sizes of mutant populations. Results for mutants with parameters that mimic control cells (blue) and for mutant cells that adopt the parameters identified for cells in the 48-h γ-irradiated case (red). The shaded region represents 1 SD. (b) Simulation snapshots of a crypt with an initial heterogeneous population of 10% mutant and 90% healthy epithelial cells (blue and red, respectively; black shows Paneth cells). After 400 h, the mutant cells have colonized the crypt. (c) The average time taken (hours) for either mutant or control cells to colonize the crypt with increasing initial proportion of mutants. Shaded red region represents 1 SD.
FIGURE 6:
FIGURE 6:
Identifying the initial proportion of mutant cells that explains the mitotic distribution in recovered crypts. (a) Experimental data for the distribution of mitotic cells in irradiated crypts after a recovery period of 3 mo (smoothed data have been fit to a nonparametric kernel-smoothing distribution). (b) The log error between simulated and experimental data for the indicated percentage of mutant crypts (x-axis). The lowest error between experimental and simulated data occurs when 64% of crypts are homogeneously mutated (black circle). (c) Mitotic distribution derived for a heterogeneous population of crypts, with 64% mutant crypts and 36% control crypts (error between simulated and experimental data indicated). (d) Best-fit histogram of mitotic events in the simulated crypt to the recovered data, assuming a homogeneous population of cells (error between simulated and experimental data indicated).

References

    1. Alberts B, Johnson A, Lewis J, Raff M, Roberts K, Walter P. Molecular Biology of the Cell, 4th ed. New York: Garland Science; 2002.
    1. Anastas JN, Moon RT. WNT signalling pathways as therapeutic targets in cancer. Nat Rev Cancer. 2012;13:11–26. - PubMed
    1. Appleton PL, Quyn AJ, Swift S, Näthke IS. Preparation of wholemount mouse intestine for high-resolution three-dimensional imaging using two-photon microscopy. J Microsc. 2009;234:196–204. - PubMed
    1. Bjerknes M, Cheng H. Clonal analysis of mouse intestinal epithelial progenitors. Gastroenterology. 1999;116:7–14. - PubMed
    1. Boman BM, Walters R, Fields JZ, Kovatich AJ, Zhang T, Isenberg GA, Goldstein SD, Palazzo JP. Colonic crypt changes during adenoma development in familial adenomatous polyposis. Am J Pathol. 2004;165:1489–1498. - PMC - PubMed

MeSH terms

LinkOut - more resources